Session score metrics
Session details now contain additional data-points to troubleshoot session performance and analyse overall session health. The additional data provides insights into the overall user-experience of individual sessions and help Admins understand the reason for poorly performing sessions. Additional data-points added are given below:
-
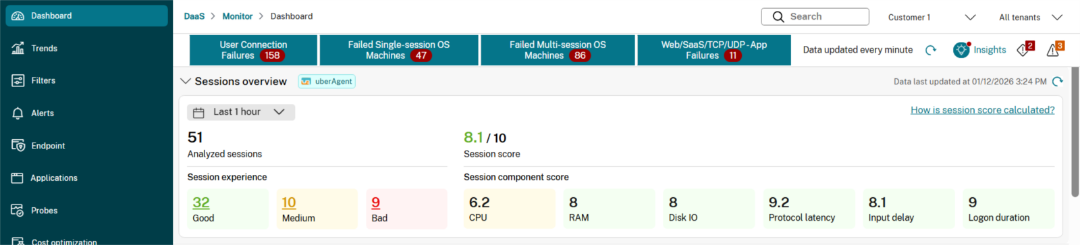
Session experience summary – It serves as a quick peek into the session experience. Shows the summary of user-experience across all the launched sessions within the environment during the selected time-period. Analysed sessions are categorised into Good, Medium, and Bad. Admins can click on an experience category to open the detailed session view (Filters page) with automatically applied filters.
-
Session and component score – Session summary also provides the average session and component score for the analysed session. While standalone average scores maybe not be a very useful metric, it can still serve as a good indicator of the session experience for majority sessions. Similarly, Admin can use the average component scores to understand the potential root cause of Bad sessions.
-
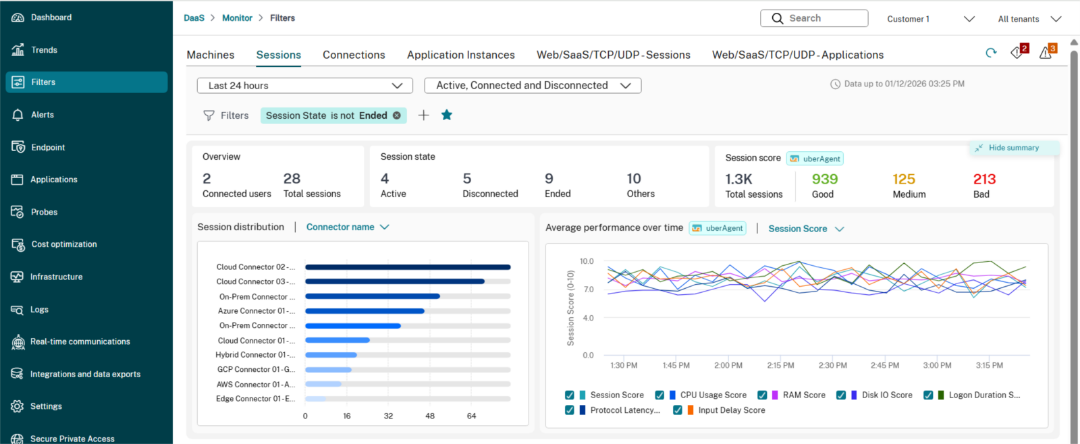
Session distribution – Session distribution chart is added on the filters page. Admin can view the session distribution by Endpoint Country, City, Endpoint OS, CWA version, ISP, etc.
-
Performance trends – Session performance trends chart is also added on the filters page. Performance chart is helpful for analysing the session and component performance trends and identify any recurring patterns based on time of day, country, etc.
-
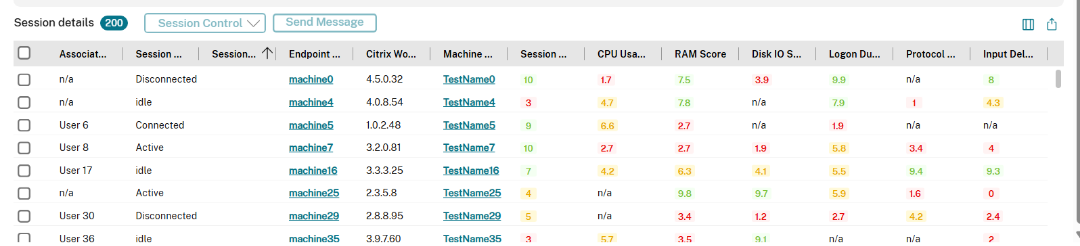
Individual session data – Following data points have been added for each session in the Session details table –
- Session score
- CPU score
- RAM score
- Disk IO score
- Protocol Latency score
- Input delay score
- Logon duration score