-
-
-
-
-
-
Resource allocation
-
This content has been machine translated dynamically.
Dieser Inhalt ist eine maschinelle Übersetzung, die dynamisch erstellt wurde. (Haftungsausschluss)
Cet article a été traduit automatiquement de manière dynamique. (Clause de non responsabilité)
Este artículo lo ha traducido una máquina de forma dinámica. (Aviso legal)
此内容已经过机器动态翻译。 放弃
このコンテンツは動的に機械翻訳されています。免責事項
이 콘텐츠는 동적으로 기계 번역되었습니다. 책임 부인
Este texto foi traduzido automaticamente. (Aviso legal)
Questo contenuto è stato tradotto dinamicamente con traduzione automatica.(Esclusione di responsabilità))
This article has been machine translated.
Dieser Artikel wurde maschinell übersetzt. (Haftungsausschluss)
Ce article a été traduit automatiquement. (Clause de non responsabilité)
Este artículo ha sido traducido automáticamente. (Aviso legal)
この記事は機械翻訳されています.免責事項
이 기사는 기계 번역되었습니다.책임 부인
Este artigo foi traduzido automaticamente.(Aviso legal)
这篇文章已经过机器翻译.放弃
Questo articolo è stato tradotto automaticamente.(Esclusione di responsabilità))
Translation failed!
Resource allocation
Requires the Metrics permission set to Access Project.
The Resource Allocation tab plots how much of your cluster workspaces are actually consuming, over time. Because a workspace holds its allocation only while it is running, the curve tracks how many workspaces are running at any moment.
The charts
Two charts are shown, one for CPUs and one for memory, with time along the horizontal axis. In a multi-region deployment each region is plotted as its own line, so you can compare them directly.
The chart titles change with where you are. The card is the same in all three places, but it is scoped to what you are looking at:
| Where you open it | Chart titles |
|---|---|
| Platform | Cluster Usage (CPUs) and Cluster Usage (Memory) |
| Organization | Organization Resource Allocation (CPUs) and (Memory) |
| Project | Project Resource Allocation (CPUs) and (Memory) |
So a project owner sees their project’s consumption, not the cluster’s. Only the platform view covers the whole deployment, which is the one to use for the capacity questions in Sizing.
Use the time range list above the charts to change the window. It defaults to Last 10 Days, and also offers Last 7 Days, Last 7 Weeks, Last 30 Days, Last 90 Days, and Last Year.
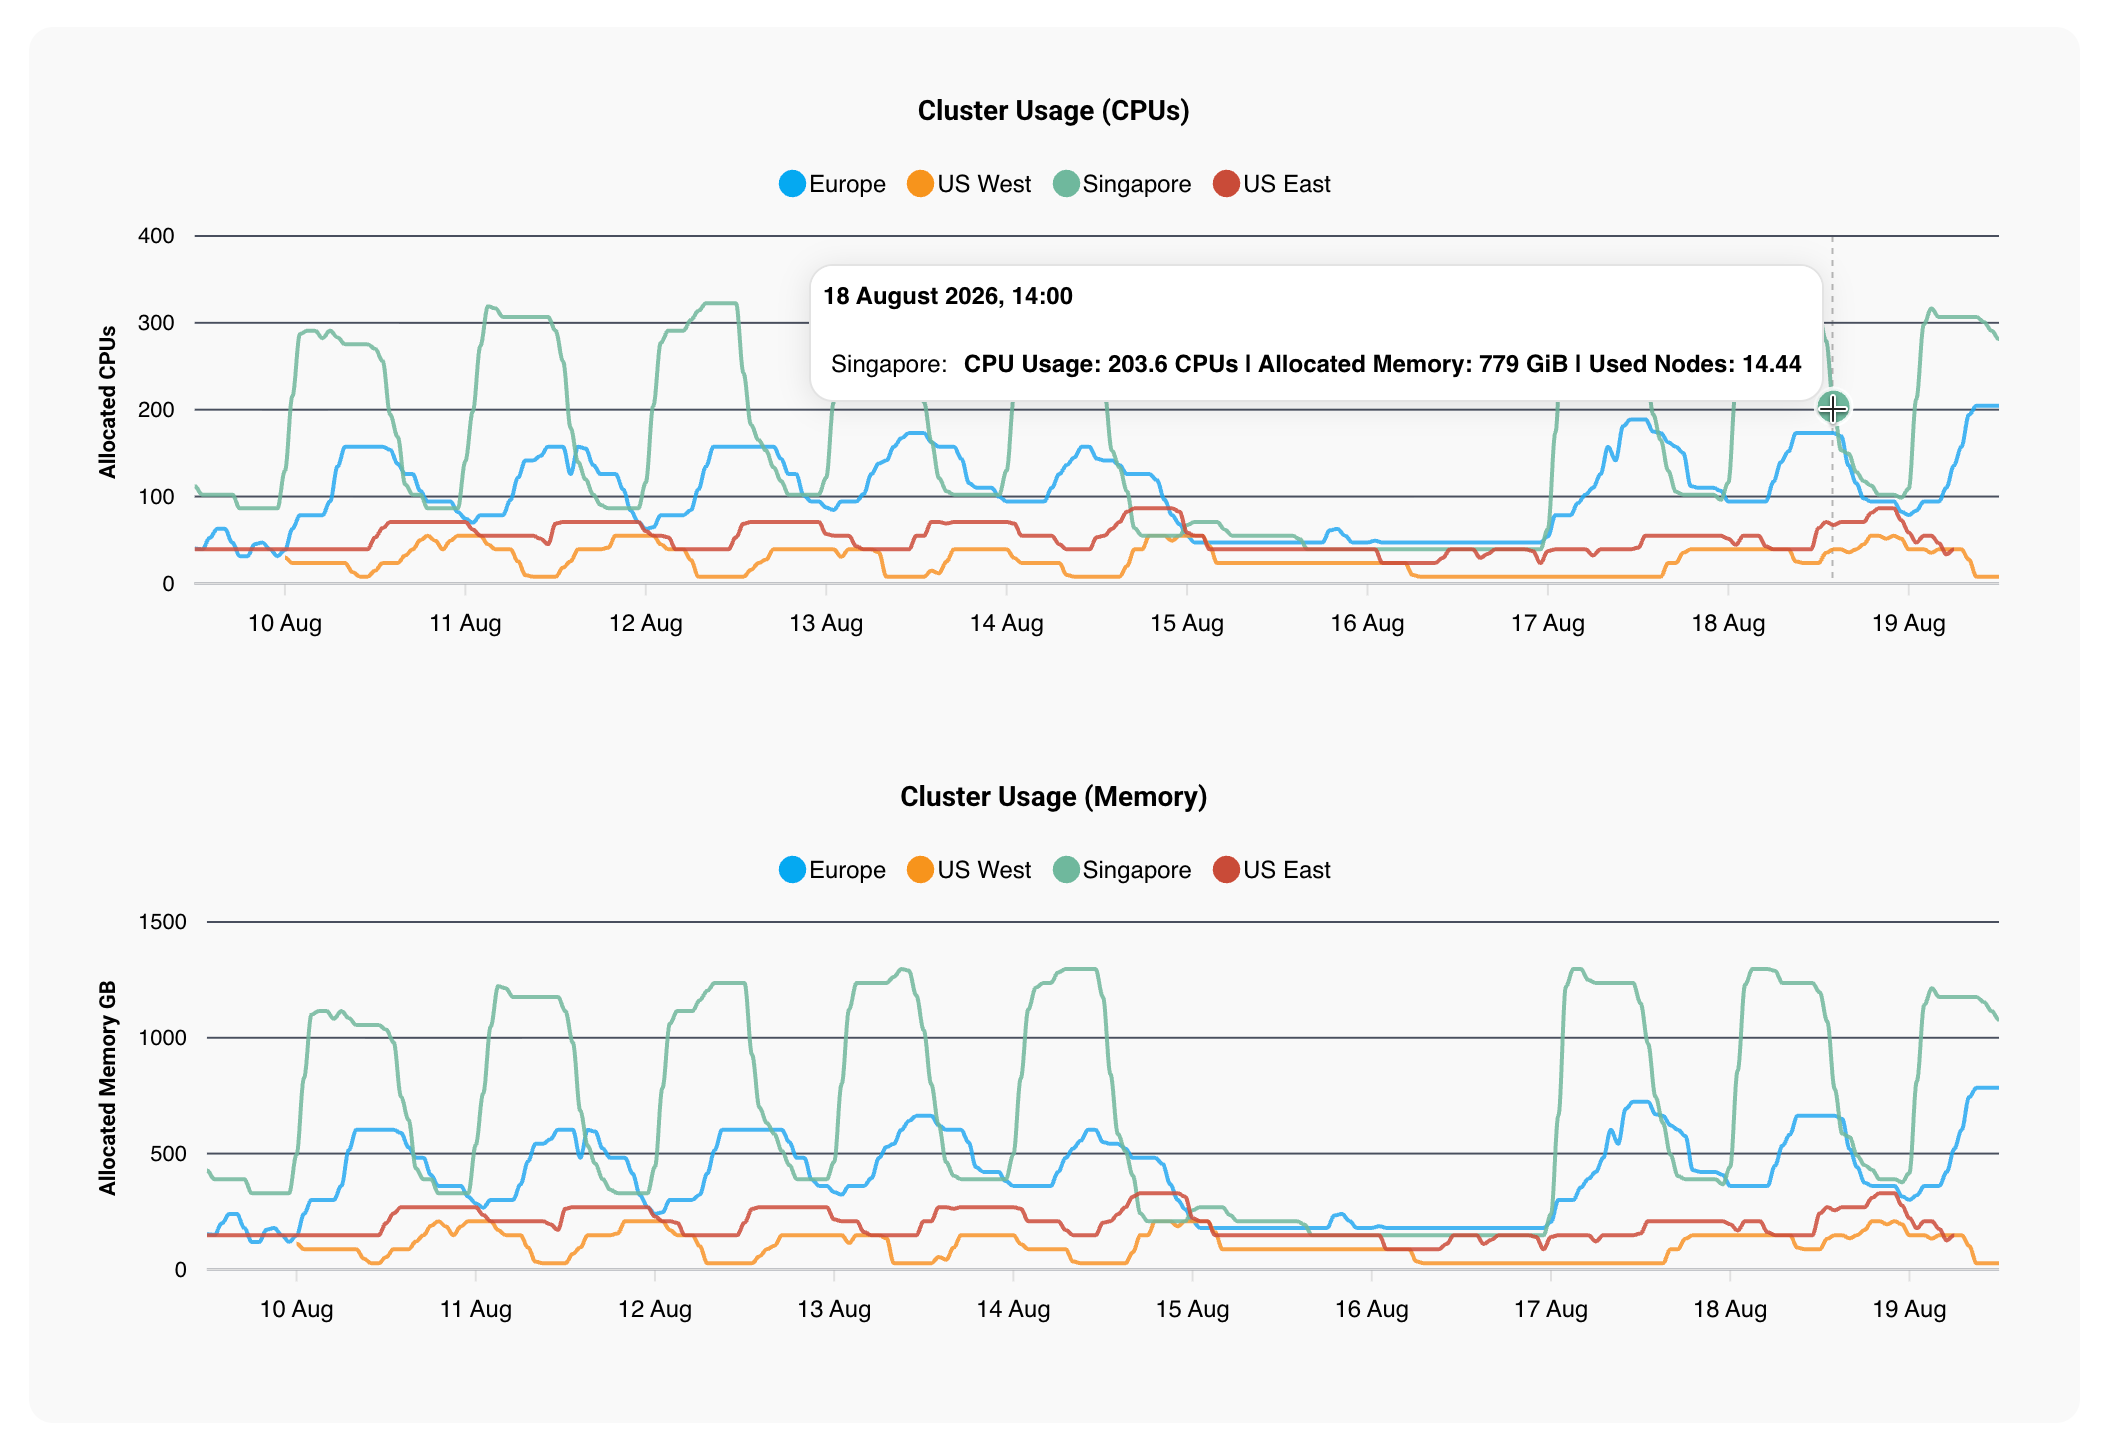
Hovering a point reports the values at that moment for that region:
| Value | Meaning |
|---|---|
| CPU Usage | Cores allocated to running workspaces |
| Allocated Memory | Memory allocated to running workspaces |
| Used Nodes | Cluster nodes in use, as an average across the interval |
Reading the shape
The shape of the curve is more informative than any single number.
A daily rise and fall is what a healthy deployment looks like. Workspaces start as developers begin work, and pause when they go idle, so usage climbs through the working day and falls away overnight. Flat stretches across weekends and holidays are the same effect over a longer period.
A curve that does not fall is the one to investigate. If usage stays high overnight, workspaces are running when nobody is using them, and you are paying for the nodes that host them. The usual causes are:
- Idle detection is not configured, or the timeout is too long. See Workspace idle detection.
- Bypass Schedule is enabled on more workspaces than intended. It is meant for unattended jobs, and it exempts a workspace from pausing entirely.
- Long-running processes are keeping sessions active.
Comparing the amplitude between regions is a quick way to see this: a region whose line barely moves, while the others cycle, is usually a configuration difference rather than a difference in how people work.
A rising baseline over weeks means the floor is climbing — workspaces that never stop, or growth in the number of workspaces. Either way it is the signal to plan capacity before it becomes urgent.
Workspace consumption
Below the charts, a sortable list shows total consumption per workspace in the project, so you can attribute a peak to the workspaces that caused it.
Each workspace is created against a specification that fixes its CPU, memory, and disk. What the list shows is consumption against that specification, which is how you find workspaces sized far above what they use.
Related information
Share
Share
In this article
This Preview product documentation is Citrix Confidential.
You agree to hold this documentation confidential pursuant to the terms of your Citrix Beta/Tech Preview Agreement.
The development, release and timing of any features or functionality described in the Preview documentation remains at our sole discretion and are subject to change without notice or consultation.
The documentation is for informational purposes only and is not a commitment, promise or legal obligation to deliver any material, code or functionality and should not be relied upon in making Citrix product purchase decisions.
If you do not agree, select I DO NOT AGREE to exit.