Service continuity monitoring dashboard
Overview
The Service Continuity Monitoring Dashboard provides administrators with centralized, immediate visibility into configuration gaps and end-user vulnerabilities that could prevent Service Continuity from functioning during a cloud outage. By monitoring readiness, administrators can use the readiness data for early detection, take corrective actions to ensure users maintain access to their applications and desktops, ultimately reducing the business impact of outages.
What is an instance, and how is data collected from it?
An instance represents a unique way a user accesses Citrix Workspace™, based on the user, the device, and how they sign in. For example, if a user signs in on one device using Chrome, Edge, and the Citrix Workspace app, each access method is tracked as a separate instance. Each instance sends an event approximately once every 24 hours.
How readiness is calculated
For an instance to be considered ready, it must satisfy the following conditions. If any of them is not met, the instance is considered “Not ready”.
For native app launch
- Service continuity is enabled
- At least one leasable resource (app or desktop) is available
- At least one valid connection lease exists
- No expired connection leases are present
For hybrid launch (login from web, session launch via CWA app)
- Service continuity is enabled
- Citrix web extension is installed
- At least one leasable resource (app or desktop) is available
- At least one valid connection lease exists
- No expired connection leases are present
Version requirements
Service continuity readiness data is available with certain Citrix Workspace app versions and above.
| Platform | Minimum supported version |
|---|---|
| Hybrid (login from web, session launch via CWA app) | Automatically updated |
| CWA Windows | 2511 |
| CWA Mac | 2603 |
| CWA Linux | 2503 |
| CWA Android | 2603 |
| CWA iOS | 2603 |
Dashboard features
Instance readiness over time chart
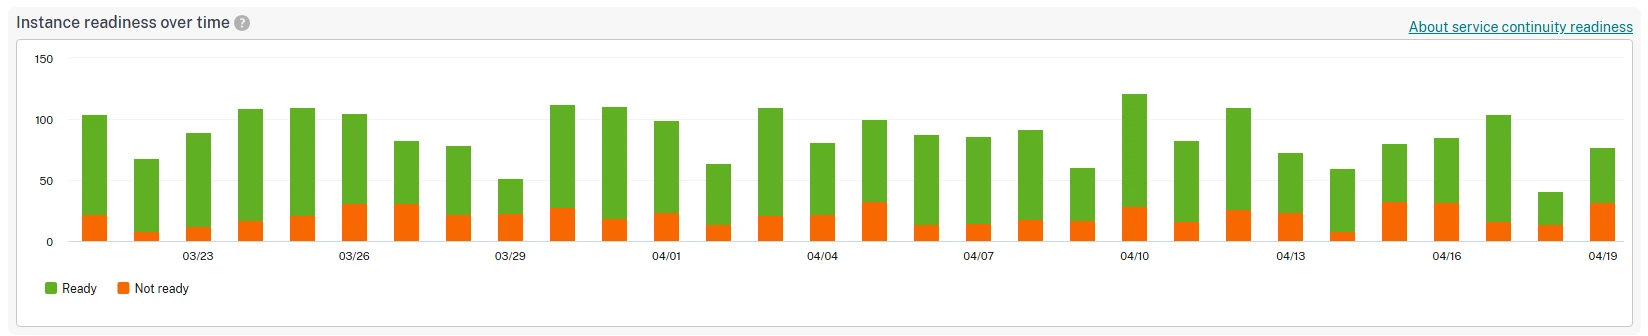
A 30-day readiness bar graph that represents the readiness count on each day. The green section represents the “Ready” instances, while the orange section represents the “Not ready” instances.
Day-wise overview panel and instance charts
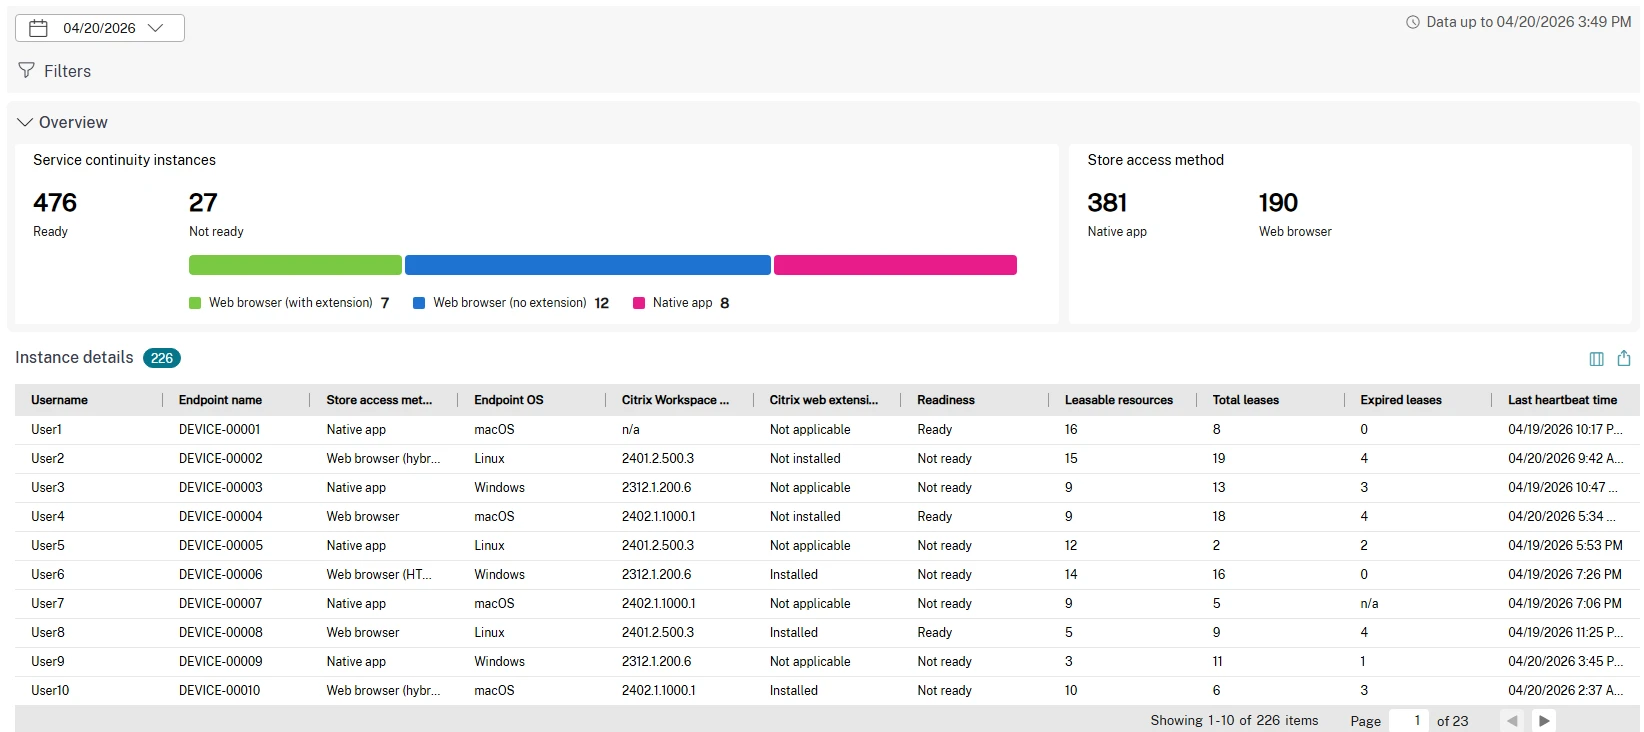
These two sections represent the data corresponding to a single day. By default, the current day is selected. Users can see the day-wise data for up to the last 7 days, and can slice and dice this data using different filters. Day-wise data is limited to 7 days because individual instance records are retained for that period, while the daily summaries behind the 30-day chart are retained for 30 days.
The current day is still in progress. Because each instance reports approximately once every 24 hours, today’s counts build up over the course of the day and are lower than those of a completed day. Select a previous day for a complete view.
Overview panel
The overview panel contains the following subsections:
-
Service continuity instances
It shows the count of Ready and Not ready instances. A chart is displayed below the “Not ready” section, showing a platform-wise split of the not ready instances.
-
Store access method
This section represents the day-wise split of the user store access method. Native app represents logins from the Citrix Workspace app on platforms such as Windows, Linux, and Android, while Web browser shows store logins through a browser or HTML5 platforms.
Instance details
Instance details consist of all the readiness events received over the course of the selected day. Each row represents a single instance. The table can also be exported as a CSV file.
Filters
The data can be filtered using the date filter and filters based on data fields. The following data fields are supported:
- Citrix Workspace app version
- Endpoint OS
- Readiness
- Store access method
Table fields
The columns are grouped into User, Endpoint, and Service continuity. Use Manage columns to add or remove the optional ones.
| Category | Field | Info | Visible by default |
|---|---|---|---|
| User | Username | The user’s username | Yes |
| Endpoint | Endpoint name | The hostname of the user’s endpoint | Yes |
| Endpoint | Store access method | How the user is accessing the store - CWA app or via a browser | Yes |
| Endpoint | Endpoint OS | Endpoint OS platform (Windows, macOS, Android, and so on) | Yes |
| Endpoint | Citrix Workspace app version | The version number of the installed native app | Yes |
| Endpoint | Citrix web extension | Denotes whether the user has installed the Citrix web extension. It is “not applicable” for a pure native launch | Yes |
| Service continuity | Readiness | Readiness based on the formula explained above (Ready/Not ready) | Yes |
| Service continuity | Leasable resources | The count of leasable resources (apps and desktops) the user has access to. These can be launched in a partial outage scenario | Yes |
| Service continuity | Total leases | Count of total leases on the user’s device when the sync happened | Yes |
| Service continuity | Expired leases | Count of expired leases on the user’s device when the sync happened | Yes |
| Service continuity | Last lease sync | The last time the user’s device synced the lease files. By default, lease sync happens every 6 hours | No |
| Service continuity | Last heartbeat time | The timestamp when the user data was synced with the dashboard. Every instance sends a heartbeat with all the relevant information approximately once every 24 hours | Yes |