Integrations and data exports
Citrix Monitor now provides a new UI for integrations and data exports. This feature helps to improve the awareness of the various interfaces and third-party integrations available in Citrix Monitor. The newly introduced Integrations and Data exports page lists the following:
- Available integrations
- Supported developer tools
This page also describes the REST API set up for data exports. Also, provides reference links to the guides and documents to get started with the integrations and developer tools.
The following integration options are provided for collecting Citrix monitoring metrics:
-
Citrix Monitor Service API - You can use the Citrix Monitor service API to collect performance data and events from Citrix Monitor and export them to Power BI.
-
Alerting and ITSM - You can send alert notifications to the following third-party applications that have incoming webhook URLs configured:
- Slack
- Microsoft Teams
- ServiceNow
Click Integrations and Data exports from the left navigation menu. The Integrations and Data exports page appears.
Developer tools:
View available integrations
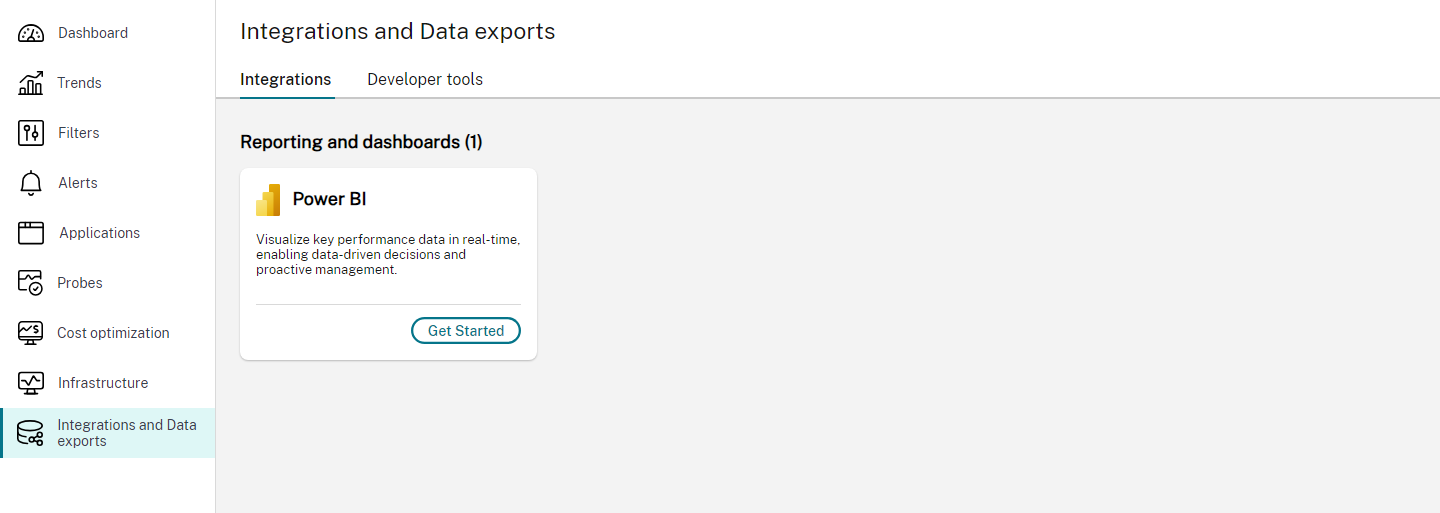
The Integrations tab displays the available integrations for Citrix Monitor. The available integrations are categorized into the following:
- Reporting and dashboards
- Alerting and ITSM
Reporting and dashboards
Power BI can be used for visualizing metrics collected through the Citrix Monitor API. Click Get started. The REST API developer tools details page appears.
Click Monitor service API to get reference links to resources and blogs with respect to its integration with PowerBI.
This page provides reference links to resources and blogs.
Integrations with alerting and ITSM tools
The alerting and ITSM tools include the following:
- Slack
- Microsoft Teams
- ServiceNow
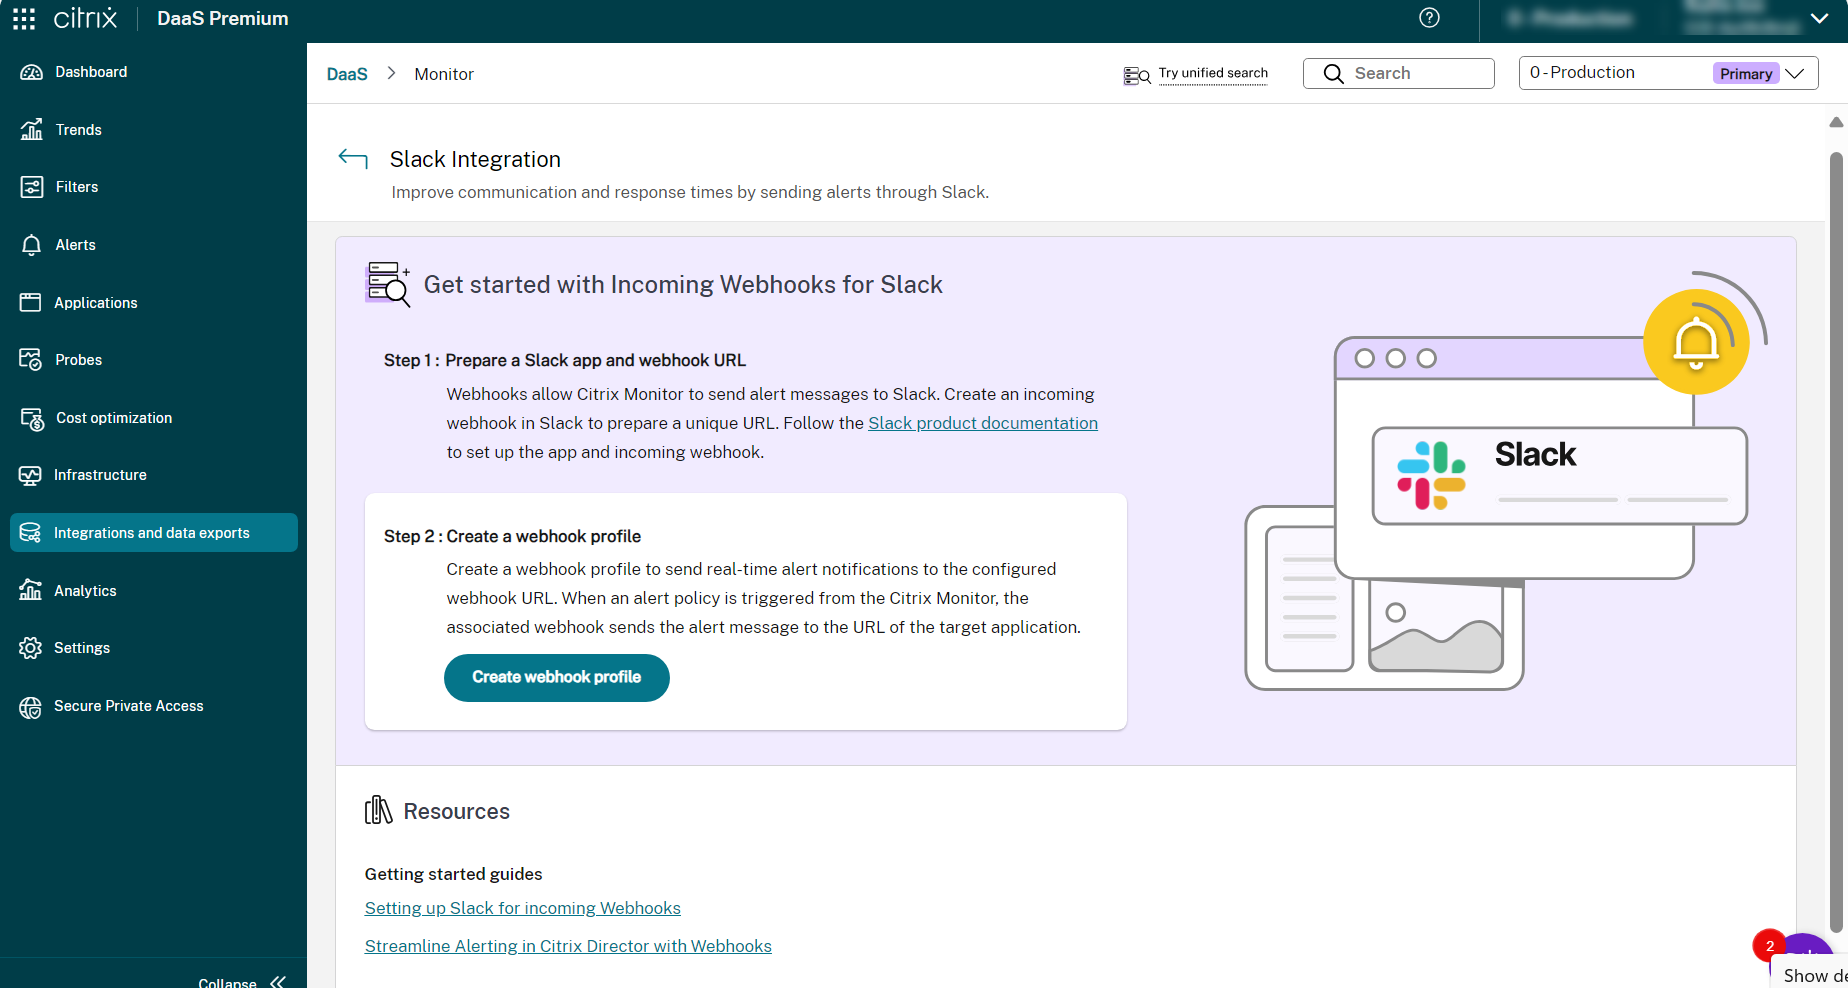
To integrate the alerting and ITSM tools with Webhook, click the Get started link next to the tools. This link opens the integration page for the specific alerting and ITSM tool, providing details on prerequisites and specific steps to send alerts. You can set up the tools and webhook URL. For example, to integrate Slack, you need to create a channel and Webhook URL following the Slack documentation.
Once that is done, proceed with the second step to create a webhook profile.
You can also go through the reference resources. For example, the prerequisites and instructions for integrating with Slack are as follow:
Integration with Webhook
- Click the Integrations tab > Alerting and ITSM section > Get started next to the selected tool. The Integration page for that tool opens up.
- [Optional] You can access the reference links to resources and blogs.
- Follow step 1.
- Click Create webhook profile as part of step 2. The
<name of the tool>Create Webhook profile page appears. - Enter the Name of the Webhook profile.
- Enter the Description for the Webhook profile.
- Select the desired Method in the Webhook configuration section.
- Enter the API/Webhook URL according to the selected method in the previous step.
- View the Message format.
- [Optional] Add the key and value in the Headers section.
- Click Test to validate the created webhook.
- If the webhook is validated successfully, click Create Webhook. The Webhook is created.
- View the created webhook profiles at Developer tools > Webhook > Manage. The Webhook profiles developer tool details page opens.
You can also create webhook profiles at Developer tools > Webhook > Create webhook profiles.
Integrating the Webhook Profiles with Citrix Alerts
You can view the created webhook profiles at Alerts > Advanced Alert Policies > Create Policy section and use it as part of Citrix Alerts.
To integrate a webhook profile with a new Citrix alert policy, do the following:
- Click Alerts > Advanced Alert Policies > Create Policy. The Create advanced alert policy page appears.
- Navigate to Notification channels > Use Webhook section.
- Select the webhook profile.
- Save the alert policy.
You can integrate a webhook profile with an existing alert policy by doing the following:
- Click Alerts > Advanced Alert Policies > Edit Policy. The Edit advanced alert policy page appears.
- Navigate to Notification channels > Use Webhook section.
- Select or change the webhook profile.
- Update and save the alert policy.
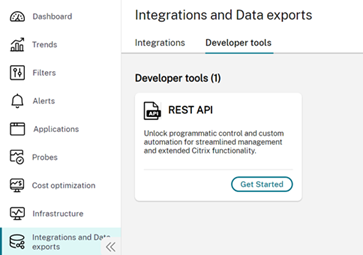
View supported developer tools
Click Developer tools tab to view the available developer tools.
The available developer tools are Monitor service API and Webhook.
Kafka Data Exports
Kafka Data Exports enables administrators to stream Citrix Monitor event data to external SIEM and observability platforms, such as Splunk, Elastic, and Azure Sentinel. Supported event data includes events from Secure Private Access (SPA) and Device Posture Service (DPS).
To access the configuration, use one of the following paths:
- Integrations and data exports > Developer tools > Kafka on the Integrations and Data exports page.
- Secure Private Access > Kafka in the left navigation menu.
The Kafka Configuration page appears.
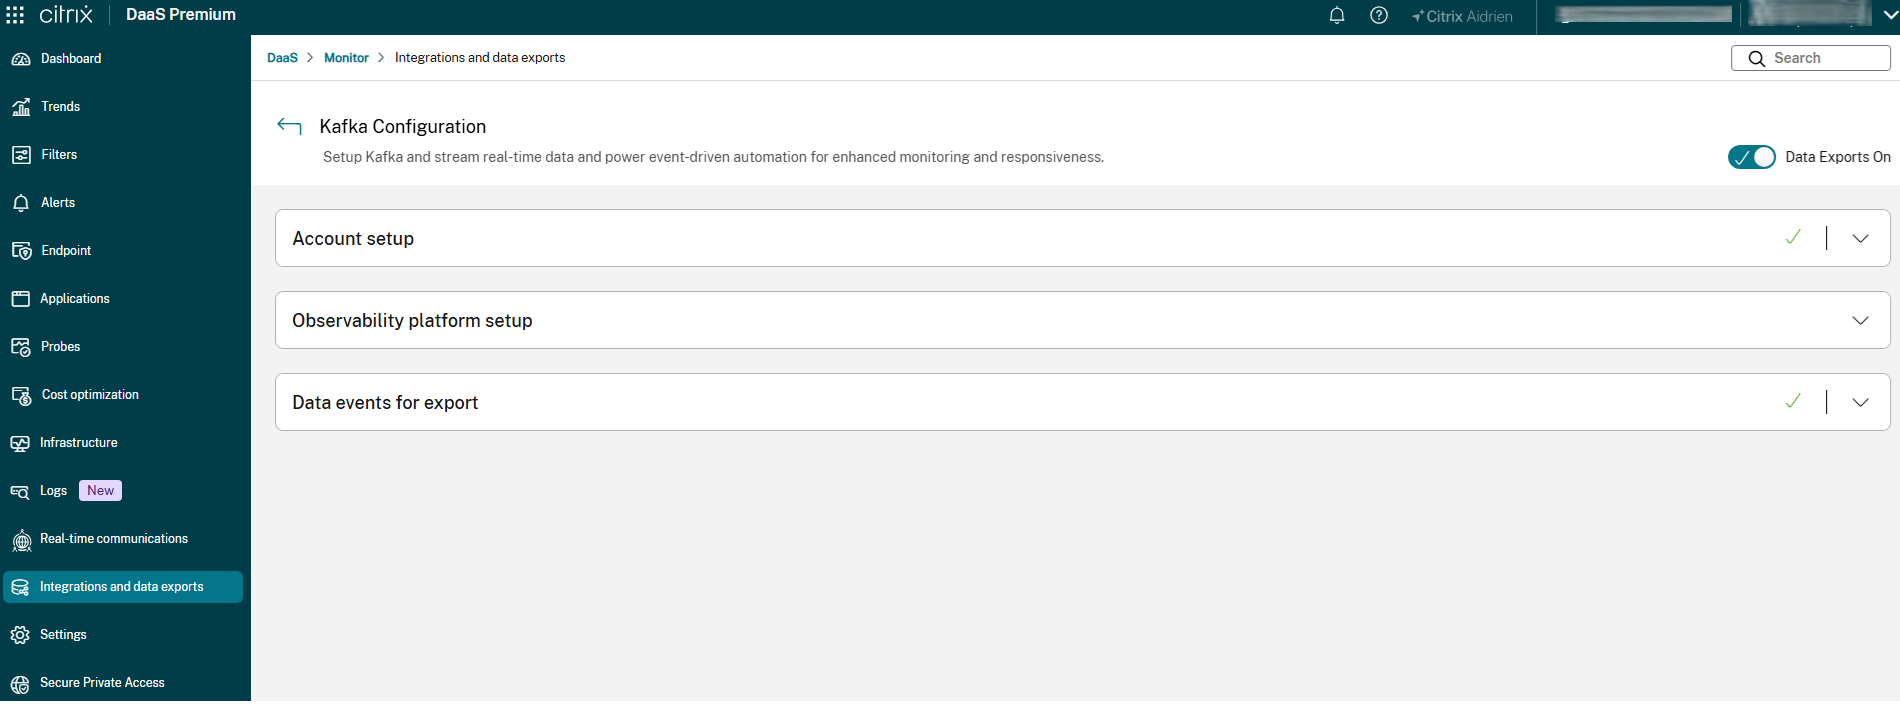
The Kafka Configuration page contains three sections:
- Account setup — Create the Kafka account credentials required for SIEM tool connectivity.
- Observability platform setup — Retrieve the connection details needed to configure your chosen observability platform.
- Data events for export — Select which event types are streamed to the observability platform.
Use the Data Exports toggle in the upper right to enable or disable the export stream at any time.
Account setup
The Account setup section lets you create a dedicated account that Citrix Monitor uses to generate the configuration files required for Kafka integration.
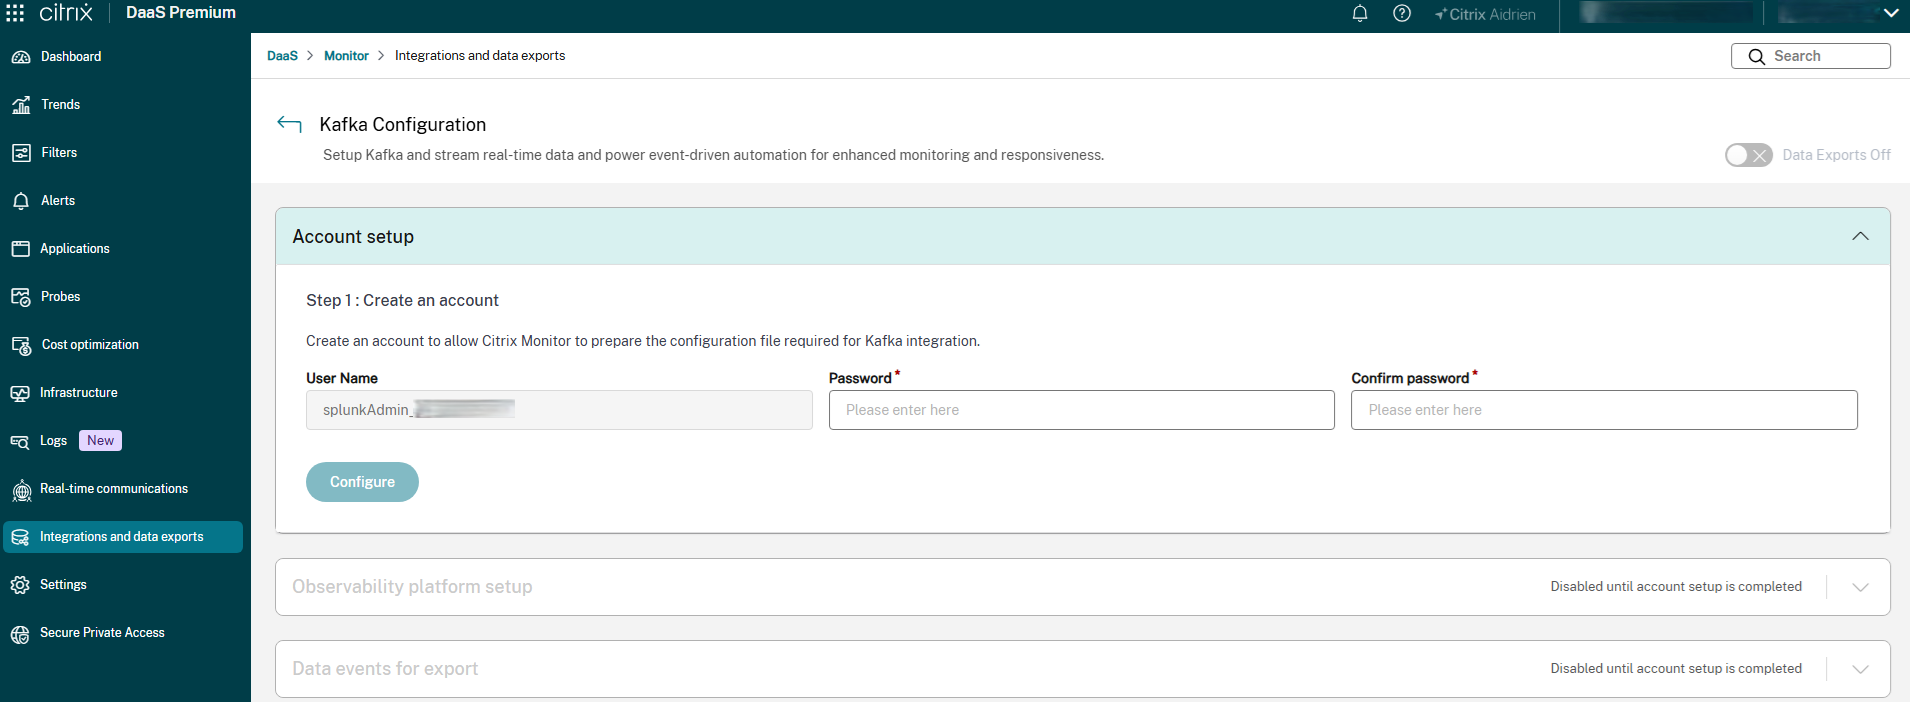
To set up the account, do the following:
- Expand the Account setup section.
-
In the Password field, enter a password for the account. Enter the same password in Confirm password.
Note:
The User Name is generated automatically by Citrix Monitor and cannot be edited.
- Click Configure. Citrix Monitor creates the account and prepares the configuration files.
To update the account password at any time, click Reset password, enter a new password, and click Reset again.
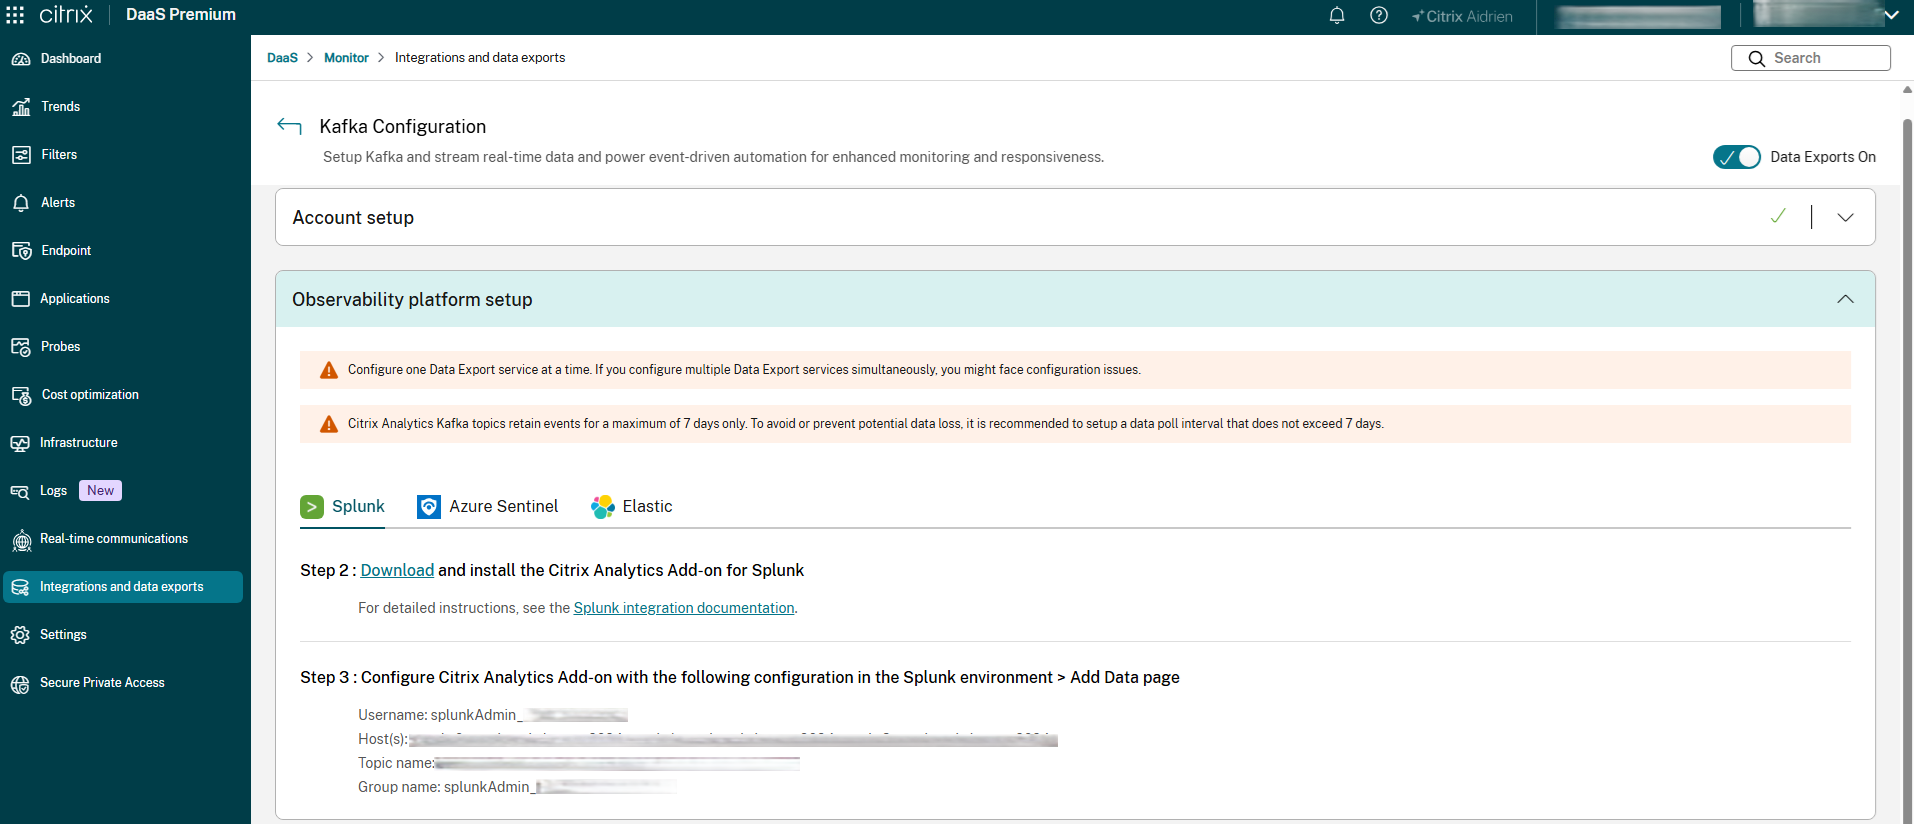
Observability platform setup
The Observability platform setup section provides the Kafka connection details you need to configure your SIEM or observability tool.
The following observability platforms are supported:
- Splunk
- Azure Sentinel
- Elastic
To configure your observability platform, do the following:
- Expand the Observability platform setup section.
- Select the tab for your observability platform (for example, Splunk).
- Follow the on-screen steps:
- Step 1: Complete the Account setup section to create the Kafka account credentials. See Account setup.
- Step 2: Download and install the Citrix Analytics Add-on for your platform. For detailed instructions, see the integration documentation linked on the page.
-
Step 3: Use the connection details displayed on the page to configure the Add-on in your platform environment. The details include:
- Username
- Host(s)
- Topic name
- Group name
Data events for export
The Data events for export section lets you choose which event types from each data source are included in the export stream.
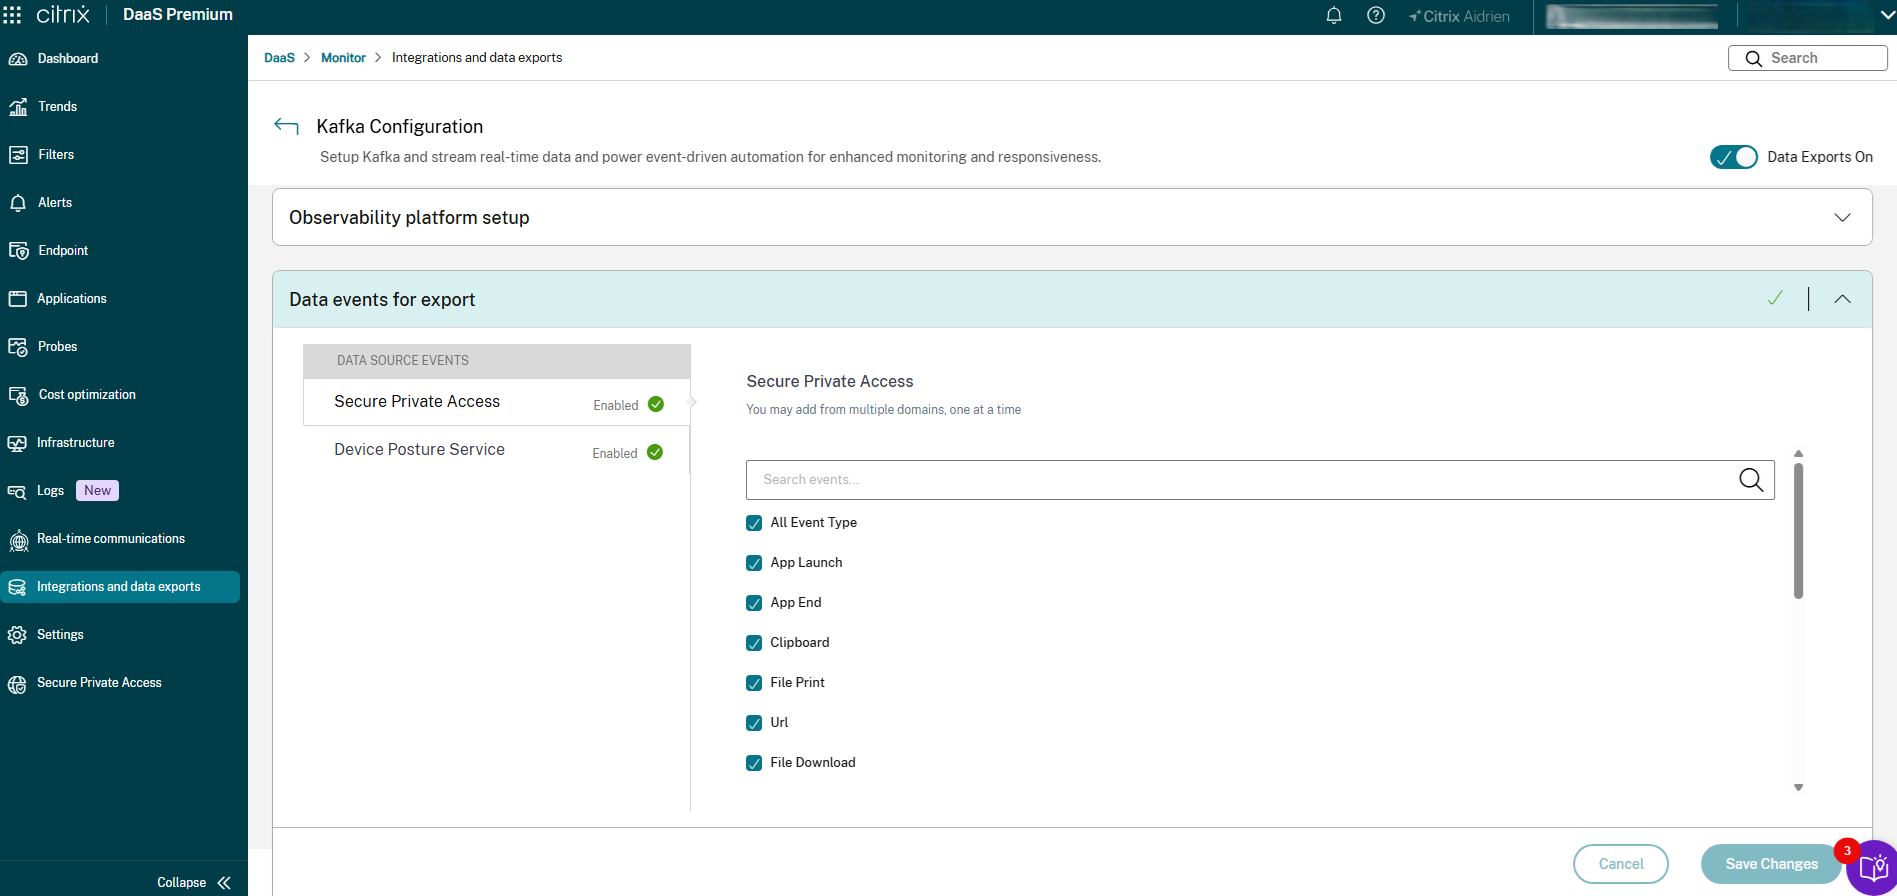
The available data sources are:
- Secure Private Access — Available to admins with a Secure Private Access entitlement. Supported event types include App Launch, App End, Clipboard, File Print, URL, File Download, and others.
- Device Posture Service — Available to all admins. Includes Device Posture Evaluation events.
To configure event types for export, do the following:
- Expand the Data events for export section.
- In the Data Source Events panel, select a data source (for example, Secure Private Access).
- In the right panel, select the event types to include in the export. Use the search field to filter events by name. Select All Event Type to include all available events for that source.
- Repeat for each data source as needed.
- Click Save Changes.
Monitor service API
Click Get started. The Monitor Service API developer tool details page opens. You can access the reference links to resources and blogs.
Webhook
You can view and create webhook profiles at Developer tools > Webhook > Create webhook profiles.