What’s new
A goal of Citrix is to deliver new features and product updates to Citrix Analytics customers when they are available. New releases provide more value, so there’s no reason to delay updates.
To you, the customer, this process is transparent. Initial updates are applied to Citrix internal sites only, and are then applied to customer environments gradually. Delivering updates incrementally in waves helps to ensure product quality and to maximize the availability.
April 15, 2024
New Executive Summary report
You now have the option to consolidate multiple reports into a single executive report which can be scheduled for the required time period. With this new feature, you are only providing your audience with necessary graphical information. For more information, see Executive summary report.
January 29, 2024
Workspace App Status field updates
- Self-Service Search: You can now perform queries to find out the support status of a Workspace App version by utilizing the newly introduced Workspace App status field for the Citrix Apps and Desktops data source.
- Users: The Workspace App Status column has been removed.
For more information, see self-service search for Apps and Desktops.
January 25, 2024
Inconsistencies in the CAS UI are streamlined
The following problems have been resolved in the Self-Service Search feature for the Apps and Desktops data source:
- Events that were previously displayed out of order within a session now appear correctly.
- The default columns have been updated.
January 24, 2024
Enhanced user profile events on SIEM environments
The user profile events exported to your SIEM environments now include:
- IP address insights
- Citrix Virtual Apps and Desktops™ and Citrix DaaS (formerly Citrix Virtual Apps and Desktops service) location insights
These new enhancements enable you to identify the client’s IP address used to access your organization’s data and gather user location information from both Citrix Virtual Apps and Desktops, as well as Citrix DaaS.
For more information, see Risk insights data for SIEM.
December 01, 2023
Admin Email Settings page for Weekly email and SIEM alerts
The new Admin Email Settings feature allows you to configure custom distribution list recipients for system alerts. This enhancement ensures that administrators receive only the system alerts that are relevant to them.
For more information, see Admin email settings.
Users dashboard - New active user count time filter and updated the Overview section
The new time filter in the Users dashboard allows you to view and modify the total number of active users in your organization for a specific time period, considering the data sources for which you have enabled Citrix Analytics.
The enhanced Overview section in the Users dashboard displays the total number of users in your organization, as well as the number of active and inactive users who are currently logged on.
For more information, see Users dashboard.
Enhanced custom reports
- You can now create and schedule custom reports using the events and insights available in Citrix Analytics for Security. Custom reports help you to extract information of specific interest and organize the data graphically.
- You can now use the enhanced Custom Report platform capabilities that include Self-Service Search query-based reports, templates, better visualizations, coverage of all data sources and metrics, scheduling reports, and exporting PDFs.
For more information, see Custom reports.
November 30, 2023
Removal of all ShareFile capabilities in Citrix Analytics
The following ShareFile detection capabilities are removed:
- Share Links
- Associated Risk Indicators
- Policies with their occurrences
- Content Collaboration Data Export configurations
- Content Collaboration Reports
- Content Collaboration datasource on Search
- Content Collaboration Saved Searches
- Content Collaboration Data Source.
The removal of these capabilities might result in a temporary inconsistency in risk score and user timelines. All other Citrix Analytics capabilities remain the same.
Learn how ShareFile simplifies access to security controls directly from ShareFile.com.
September 22, 2023
Citrix Secure Browser data source in Custom Indicator
You can now create risk indicators for the Citrix Secure Browser data source to track a user’s activity in the Secure browser. For more information, see Custom Indicators.
Enhancement of Weekly Email with SIEM Data Export
The Weekly email has been enhanced to provide deeper insight into your organization’s security posture by enabling the SIEM data export. You can now onboard and activate more data sources to discover a wide range of events around your users. The weekly email includes the following new additions:
- The data summary section shows the status of data consumption in the SIEM environment.
- Recommendations for Data Exports based on the data export consumption status.
For more information, see Weekly email notification.
Consumption of custom administrator’s notification preferences in emails
Citrix Analytics for Security now honors the notification preferences set by custom administrators in Citrix Cloud. This enhancement provides custom administrators with greater flexibility in managing their notification preferences. This preference is also leveraged while sending notification emails such as weekly emails, Notify Administrators action emails, and alerts for data exports.
For more information, see Manage administrator roles for Security Analytics.
July 04, 2023
OR operator support in Self-Service Search and Custom Indicator
The OR operator is now available in the Self-Service Search and Custom Risk Indicator features. You can use the OR operator in search views such as Self-Service Search and Custom Indicator queries.
For more information, see Supported operators in search query.
June 15, 2023
Enable VDA clipboard telemetry
An event called VDA.Clipboard triggers when you initiate any clipboard operation in Citrix Apps and Desktops. These clipboard logs provide vital information such as the VDA name, clipboard size, clipboard format type, client IP, clipboard operation, clipboard operation direction, and whether the clipboard operation was permitted. The VDA Clipboard event attributes are also available on the Self-service search and Custom Risk Indicators workflows.
- Self-service search: You can generate reports, save queries and review the VDA.Clipboard events along with all its attribute details.
- Custom Risk Indicators: Attributes for the VDA clipboard events are available with Custom Indicators workflow. You can use these event key/value pairs to configure custom indicator triggers and setup automated policies with actions.
You can use the Clipboard place metadata collection for Security monitoring policy to enable the clipboard telemetry and transmission of clipboard logs to Citrix Analytics for Security. By default, this policy is enabled. To disable, navigate to the Policy page and disable it to stop the collection of data from the VDAs.
For more information, see Enabling clipboard telemetry for Citrix DaaS.
June 14, 2023
Availability of Session Recording App lifecycle and Registry events in Citrix Analytics for Security
The following App Lifecycle and Registry events from Session Recording are now available in Citrix Analytics for Security:
- Citrix.EventMonitor.RegistryChange
- Citrix.EventMonitor.SessionLaunch
- Citrix.EventMonitor.SessionEnd
- Citrix.EventMonitor.Clipboard
- Citrix.EventMonitor.FileTransfer
You can view these events, create custom indicators, and export these events to your SIEM environments.
For more information, see Event types and supported fields.
June 08, 2023
Fixed issues
-
Some session logon events that are sent to Citrix Analytics for Security, do not have a username. This results in the username column showing as NA for some events on Self Service Search and Access Assurance User Logons page. Sometimes, It also results in having a unique user count as zero although the total logon count is non-zero in the Access Assurance IP Registering Organizations chart when viewing the data for a small time range such as Last 1 Hour or Last 1 Day. This issue is fixed now.[CAS-70954]
-
In Self-service search for Apps and Desktops, for Session.Logon and Session.end user events, the App-Name dimension in search queries is populated with Delivery Group names rather than the name of the application or desktop launched, which can be misleading to administrators. The App-Name dimension is more useful for queries on App.Start/App.End events, as it points to the applications which are being launched. For more details, refer Self-service search for Apps and Desktops. This issue is fixed now. [CAS-67968]
-
If your organization is onboarded to Citrix Cloud in the Asia Pacific South home region, the Content Collaboration events are not visible in your Citrix Analytics tenants. This issue is fixed now. [CAS-62317]
-
Few versions of the Citrix Workspace app and Citrix Receiver client do not send specific events to Citrix Analytics. Therefore, Citrix Analytics cannot provide insights and generate risk indicators for these events. This issue is fixed now. For more information, see Check 6: Are the virtual apps and desktops events transmitted to Analytics?. [CAS-16151]
May 29, 2023
Citrix Analytics Add-On for Splunk Now Available on Splunk Cloud Platform
Splunk Integration for Citrix Analytics utilizes Citrix Analytics Add-On for Splunk to connect to the analytics environment and bring in business critical data into your Splunk Environment.
Earlier, the add-on was vetted by Splunk only for installation on the Splunk Enterprise layer and the customers were responsible for configuring the add-on within their on-premises Splunk environment. With the latest version of 2.1.2, the add-on has the added Splunk platform compatibility with Splunk Cloud. Customers using Classic instances with IDM or Victoria instances can utilize this platform compatibility enhancement. Now, customers have the flexibility to choose between Splunk Enterprise or Splunk Cloud while considering the deployment of our add-on to facilitate Splunk integration.
For more information, see Splunk Integration.
Session Recording events in SIEM
The Session Recording events can now be exported to SIEM in the form of Risk Insight events and Data Source events for Apps and Desktops. The newly added event types can be found in the Data events for export stage under the Data Exports page.
For more information, see Policies and Actions.
May 24, 2023
Notify End User Global Action
The Policies and Actions feature in Citrix Analytics now supports the Notify End User global action which can be paired with built-in or custom risk indicator trigger(s). Administrators can create policies with the Notify End User action that generates email notifications for end users only. This action can be used for various of compliance use cases such as notifying the users for unsanctioned application usage, or alerting for suspicious behavior on their Citrix accounts without taking any disruptive actions. Administrators can customize the email message body and subject line depending upon the specific scenario.
For more information, see Notify End User.
May 04, 2023
Test Event Generation
The Test event generation feature is created to aid customers for quickly testing their Citrix Analytics - SIEM pipeline. Earlier, if the administrator had to test this integration, she/he would have to wait for data source onboarding and user activity to check if the events were being generated by Citrix Analytics and hence received by their SIEM environment. This is no longer a necessity. One can simply click the Send test data button to send a dummy event into the SIEM environment and use the query provided to check if the Citrix Analytics SIEM Integration is set as expected. This can also work for the administrator who’s trying to debug disrupted data flow since it can help in isolating the point of failure.
For more information, see Test Event Generation.
SIEM Email Alert Generation
The SIEM Email Alert Generation capability takes the troubleshooting journey of Data Exports to a new level of ease. Citrix Analytics sends system alerts for activities that can lead to or indicate SIEM data flow disruption. The email gets distributed amongst Citrix Cloud administrators, Security full administrators, Security read-only administrators, and Security and Performance read-only administrators. The following are the different types of alerts that are sent:
-
SIEM Data Export Alert - Password was reset
This email is triggered whenever the account password is reset from the Data Exports page. If only done on Citrix Analytics for Security GUI, it can lead to disruption in the data flow. This alert contains the time at which password reset was performed and hence makes getting back to successful data flow that much easier.
-
SIEM Data Export Alert - Data Flow Stopped
This email is triggered whenever the customer has faced data flow disruption form
-
More than 24 hours - Critical time to quickly get back to successful data flow by using the helpful troubleshooting tips within the alert or utilizing the Data Export Summary tab with Quick Guide.
-
More than 7 days - The Kakfa retention policy for each customer’s topic is seven days which means there’s a possibility that some security postured data has expired. Imperative to use the troubleshooting tools to reinstate data flow to SIEM.
-
More than 30 days - This means that the customer has suffered from security-inclined data and needs to pay immediate attention to restoring the data flow from Citrix Analytics to the SIEM environment.
For more information, see SIEM Email Alert Generation.
April 13, 2023
Fixed issue
Windows Citrix Workspace™ App sends an empty file name, path, and format property from Citrix Workspace App Version 2203 and later versions. As a result, Citrix Analytics for Security GUI shows NA values for Download File Name, Download File Path, and Download File Format columns. This issue is fixed now. [CAS-73498]
March 31, 2023
Session Recording Events in Citrix Analytics for Security
In Citrix Apps and Desktops, two new event types have been added to help identify and assess session recording-based events.
- Citrix.EventMonitor.RDPConnection
- Citrix.EventMonitor.UserAccountModification
Administrators can now easily identify and assess potential security risks. They can use these events to gather information on vital data such as process IDs, destination IP addresses and descriptions of user account operations. Additionally, these events can also be found on Custom Risk Indicators page and the Self-Service Search page.
- Self-Service Search: You can view these events along with their attribute details.
- Custom Risk Indicators: You can configure any custom indicator using these event types. For more information, see Event types and supported fields.
App Protection Events in Self-Service Search
A new event called AppProtection.ScreenCapture triggers when you try to capture a screenshot while being in a protected session under Citrix Apps and Desktops data source. The AppProtection.ScreenCapture events are also available on Self-Service Search and Data Exports pages.
- Self-service search: You can view the AppProtection.ScreenCapture results along with all its attribute details.
- Data Exports: You can view the AppProtection.ScreenCapture event type under the Data Exports section. Navigate to, Settings > Data Exports > Configuration > Data Events for Export > select Apps and Desktops from the Data Source Events (Optional) category.
You can also view a new attribute called App Protection Policies for the Session.Logon event.
For more information, see Event types and supported fields.
March 30, 2023
Custom Roles support
An administrator can be added for custom roles using groups in your Active Directory or Azure Active Directory or by setting up an Okta integration for Citrix Analytics for Security. This integration enables a streamlined approach to manage service access permissions for all group administrators.
After successfully adding an administrator to Active Directory or Azure Active Directory, the administrator can create groups and assign a custom role to a specific group. Individual permissions are given preference over group permissions if an administrator is a member of both.
For more information, see Custom Roles Support.
Troubleshooting panel for SIEM UI
The Data Exports UI is enhanced with the following changes:
-
Summary Tab: The Summary tab describes the SIEM event metrics, data source onboarding status and the data consumption status in the following scenario:
- Available Data in Citrix Analytics: Provides the onboarding status for the different data sources.
- Available Events for SIEM Consumption: Provides the number of insights that are being sent to your SIEM environment.
- Data Consumption by SIEM: Provides the data consumption status.
-
Configuration Tab: The Configuration tab contains the information about your account setup, SIEM environment setup and data events selection.
-
Data Export Quick Guide: Administrators can now make use of the Quick Guide, which makes it simpler to set up and maintain SIEM integrations. The Data Export Quick Guide link is accessible from both the Summary and Configuration tabs.
For more information, see Troubleshooting Data Exports.
March 24, 2023
Change in User Profile view
Users’ profile data related to Applications, Locations, Devices, and ShareFile data usage are not available on the User Info page in User’s Timeline. The following user information that comes from Active Directory is still available -
- Job Title
- Address
- Phone
- Location
- Organization
There are no changes in the user profile data that is exported to SIEM. For more information, see User profile.
Removal of Dynamic Auto-suggestions from all Search Views
The auto-suggestion functionality for dimensions based on the tenant’s historical data is now deprecated for the following pages:
- Self-Service Search
- Custom Risk Indicator
However, static suggestions for dimensions such as Event-Type and Clipboard-Operations are still available in the search box.
For more information, see How to use self-service search.
March 21, 2023
Recommendations panel to help onboard on-premise StoreFront™ data source
A new Recommendations panel has been introduced on the Data Sources page. The Recommendations panel on the Data Sources page educates the user on the importance of onboarding on-premise StoreFront data sources. It helps the user onboard the on-premise StoreFront data sources easily and also provides an option for the user to review and ensure onboarding of all the available data sources.
For more details, see Connect to a StoreFront Deployment.
February 23, 2023
Fixed issues
The actions are failing for the On-premises Citrix Apps and Desktop deployments where the Citrix Apps and Desktop version > 1912. This issue has been seen in both the manual and policy-based actions. This issue is fixed now. [CAS-69098]
The Self-service search for Apps and Desktops page displays multiple app start and app end events when virtual apps are launched only once. This issue occurs on Citrix Workspace app for Linux client versions. This issue is fixed now. [CAS-36236]
User events from the Secure Private Access service after 4th April 2022 and up to end of May 2022 might not be available in your Citrix Analytics tenants. This issue is fixed now. [CAS-66897]
February 22, 2023
Enhancement in weekly email notifications
Citrix Analytics sends weekly email notifications that help summarize your organization’s security risk exposures. The weekly emails notification has been improved with the following updates:
- Provides a view of the users risk distribution - total discovered users, number of risky, and non-risky users for a week
- Total events processed for a week
- Total indicators triggered for a week
- Total actions performed for a week
- Total data sources that are turned on for data processing
For more details, see Weekly email notification.
Added Download File Format field for App.SaaS.File.Download event type
In the Self-Service Search page for the Apps and Desktops data source, a new Download File Format field has been added for the App.SaaS.File.Download event type. With this change, you can now configure custom risk indicators for the Download File Format field and also export the field as part of the Export to CSV format.
For more information, see Self-service search for Apps and Desktops.
Change in Browser-derived fields
Previously, the Self-Service Search page featured the Browser, Browser Major Version and Browser Minor Version fields to represent the browser names and versions. However, to ensure clarity and accuracy, now these three fields are deprecated and replaced with Browser Name and Browser Version in Self-Service Search, Custom indicator template and CSV download for Apps and Desktops data source.
For more information, see Self-service search for Apps and Desktops.
February 16, 2023
Fixed issue
Weekly emails are affected for some of the EU and APS customers while fetching the Username Masking status for a tenant. As a result, the administrators are receiving 10 identical weekly emails because of the exception. Once the exception occurred, succeeding tenants did not receive the weekly email. This issue has been fixed now. [CAS-76138]
February 03, 2023
Analytics support for the Citrix Secure Private Access™ service available in the European Union and the Asia Pacific South regions
Citrix Analytics for Security now processes user events from Citrix Secure Private Access available in the European Union region and the Asia Pacific South region. If your organization is onboarded to Citrix Cloud from the European Union region or the Asia Pacific South region, you can view the risk insights of the users who are using the Secure Private Access service.
For more information, see Data Sources.
January 11, 2023
Removal of the Web filtering capability from Secure Private Access
The Web filtering capability has been removed from the Secure Private Access category. The following capabilities on Citrix Analytics for Security are impacted due to the deprecation of Category-based web filtering by Secure Private Access:
-
Data fields such as Category-Group, Category, and Reputation of URLs are no longer available on the Citrix Analytics for Security dashboard.
-
The Risky website access indicator which relies on the same data is also deprecated and is not triggered for customers.
-
Any existing custom risk indicators using the data fields (Category-Group, Category, and Reputation of URLs) and its associated policies are not triggered anymore.
-
The User Access and App Access tabs.
-
The SIEM exports continue to have the urlcategory, urlcategorygroup and urlcategoryreputation attributes for some time with the following dummy values:
- 99999 for Category and Category-Group
- 0 for Reputation
For more information, see Self-service search for Secure Private Access.
December 27, 2022
Change in data source drop-down for Self-service Search
The data source list is changed to reflect Sessions by default instead of Apps and Desktops in the Self-service Search page. Also, the Performance section is moved to the top followed by the Security section as the performance data sources were not visible.
For more information, see Self-service search.
December 13, 2022
Users dashboard enhancement
The Users dashboard is revamped with summaries and charts to help admins monitor the security posture of the organization. The view not only provides details of discovered users, risk indicators triggered, and actions applied, but also provides time-based trend line of critical metrics for better assessment of risks. Administrators can drill down on data of interest and navigate to relevant dashboards with the right context for faster risk analysis.
For more information, see Users dashboard.
December 05, 2022
Access assurance dashboard - Logon Network
The Logon Network section is newly added and provides the following user details:
-
The organizations associated with the IP addresses from which the users have logged on.
-
The total unique public subnet and private subnet from where the users have logged on.
-
The details that the user has logged on using proxies and private VPN services.
Using these additional details, an administrator can validate the user logon details and ensure that the user logon is within the security expectation of the organization.
For more details, see Access Assurance Dashboard.
November 18, 2022
Fixed issue
- The geofence indicators which were erroneously triggered without having any source events have been fixed. [CAS-73222]
November 08, 2022
Rename actions
Some of the actions used in Citrix Analytics for Security are renamed to provide more clarity. Those actions are:
- Notify admins - Notify administrator(s)
- Lock user - Lock user account
- Log off user - Log off active sessions
- Unlock user - Unlock user account
- Disable user - Disable User Account
For more information, see What are the actions?
Fixed issues
-
If you select an option from the timeline actions dropdown, you cannot trigger any manual action as the Clear and Apply buttons are not visible. This condition occurs in the latest Firefox version. This issue is fixed now. [CAS-72051]
-
The HardDrive, harddrive, and HDD categories are combined into a single category as Hard Disk Drive for the Download-Device-Type field in Self-Service Search for the Apps and Desktops data source. [CAS-67188]
-
Sometimes, duplicated notifications are received from Microsoft Graph with the same alert ID, and that causes the creation of duplicated risk events. A deduplication mechanism is implemented within the applications to prevent this issue. [CAS-66731]
October 19, 2022
Date Source events selection and export
You can now leverage the new Data events export workflow to export data source events in addition to the machine-learning generated risk insights events and associated data.
This enables Security and Security operations (SOC) admins to:
-
Correlate data from Citrix Analytics with other data source events aggregated on security information and event management (SIEMs)
-
Control what data events flow to SIEMs for storage cost optimization
The data events are delivered to your existing SIEM integrations and data connectors and in parity to what is available on our Self-service event search view.
For more information, see Data events exported from Citrix Analytics for Security to your SIEM service.
October 18, 2022
Allow administrator to run dynamic session recording action on Citrix DaaS™ sites
Administrators can now run dynamic session recording actions on Citrix DaaS sites and dynamically record users’ virtual sessions. They can configure the action with a policy to automatically start recording user sessions in case of a risky activity by a given user gets detected by Citrix Analytics for Security.
For more information, see What are the actions?
October 14, 2022
Provide feedback for User Risk indicators
Citrix Analytics for Security administrators can now report user risk indicators as helpful or not helpful by providing feedback on the indicators details panel. This feature enables administrators to report false positives, reduce noise for frequently triggered indicators, and share additional context with other administrators. As an additional outcome, the unhelpful risk indicator is hidden from the user’s timeline, and the user risk score is recalibrated.
For more information, see Provide feedback for User Risk indicators.
September 26, 2022
Access assurance to support geofence block list
The Safe and Risky location tabs are added under the Geofence settings.
- Safe location geofencing helps to identify and restrict access outside of a defined geofenced area.
- Risky location geofencing helps to detect and narrow down risky user access as per the organization’s known behavior.
Both Safe and Risky geofencings are backed by their own pre-configured custom risk indicators.
For more information, see Enable geofencing.
Fixed issues
-
Citrix Cloud API to display the Customer Name in the email body. Now, the email uses the nickname to display the Customer Name in the email body sent to the admins. [CAS-65350]
-
Citrix Gateway data source card is common among Citrix Analytics for Security and Citrix Analytics for Performance™. The data processing was constantly invoking Citrix Analytics for Security endpoint and was broken for customers having only Citrix Analytics for Performance entitlement. [CAS-70817]
-
When more than one entitlement messages are received simultaneously from Citrix Cloud, there is a race condition that arises while updating the Redis Cache. In such scenario, one entitlement message is updated to the cache and remaining go missing. This issue is now fixed to update all the Entitlement messages in the cache.[CAS-70823]
September 13, 2022
Sharelink dashboard enhancement
The Sharelink dashboard is revamped with a summary and detailed view. The summary view consists of the top active shares and top risky shares. The detailed view provides more information to the admin with the introduction of attributes created by, activity count, authentication type, permission, share type, and content. The Admin can drill down and filter further as needed and change/provide the time frame to see the data of interest.
For more information, see Share Links dashboard.
September 09, 2022
Impossible Travel RI Enhancement
The Impossible Travel risk indicators have been enhanced to report the registering organization and routing type of client IP addresses. These new fields are available both in the user timeline indicator detail views and in indicator details sent to SIEM.
For more information on the default policies, see the following articles:
August 19, 2022
Enable VDA Print telemetry
An event called VDA.Print triggers when a printing job is initiated in Citrix Apps and Desktops. The VDA Print events are also available on Self-service search and Custom Risk Indicators pages.
- Self-service search: You can view the VDA.Print results along with all its attribute details.
- Custom Risk Indicators: New events are provided for VDA print telemetry via EventHub and are available within Custom Indicator as well. You can use these event key/value pairs to configure custom indicator triggers.
To enable the print telemetry and transmission of printing logs to Citrix Analytics for Security, you need to create registry keys and configure your VDA. These printing logs provide vital information about printing activities such as, printer names, print file names, and total printed copies. As a security administrator, you can use these logs to analyze the risk and investigate your users.
For more information, see Enabling print telemetry for Citrix DaaS.
August 18, 2022
Fixed issue
- In the Self-Service search for Apps and Desktops and in User Logons page under the Access assurance location dashboard, the Workspace app version value was populated as NA (not available) in the downloaded CSV file, while it was available in the page view. This issue is now fixed. [CAS-70361]
August 17, 2022
Customization of end-user email per policy
You can now customize the content of the email sent to end-users per policy. Specifically, when you create a policy with the Request End User Response action or a disruptive action on the user’s account (such as Log Off user and Lock user), the email content sent to end-users when the policy is applied is customizable.
For more information on customizing the end-user mail per policy, see Policies and Actions.
August 11, 2022
New questions about Access assurance – Geolocation have been added under the FAQ article. For more details, refer FAQ.
Fixed issue
- The View All Notifications button redirected the administrator to
https://citrix.cloud.com/notificationsweekly email link that had a typo. [CAS-69236]
June 17, 2022
Data Processing is enabled by default for new paid entitlements
Previously, customers with new paid entitlement to Citrix Analytics for Security had to turn on Data Processing in the site card of specific data sources to begin processing data for those data sources.
With this release, when the new paid entitlement to Citrix Analytics for Security is provisioned, data processing is turned on by default for the following Citrix Cloud services:
- Citrix Secure Private Access
- Citrix Content Collaboration™
- Citrix DaaS
For more information, see Getting started.
June 09, 2022
Fixed issue
- Microsoft Graph risk indicators generated by Azure AD identity protection and Microsoft Defender for Endpoint may be displayed multiple times in Security Analytics. This issue is now fixed. [CAS-66593,CAS-66731]
June 02, 2022
Fixed issues
-
In the Self-service search for Policies, when selecting Policy-Name dimension in your search query to filter events, a list of non-valid policies was suggested along with the valid policies for Security Analytics. [CAS-66838]
-
The download file size of File.Download events from Windows Citrix Receiver was shown incorrectly in Self-service search. This issue surfaced because the actual value was in KBs and the UI treated the value as bytes leading to incorrect values being displayed to the users. [CAS-67105]
May 24, 2022
Introducing Impossible travel risk indicators for Content Collaboration, Citrix DaaS and Citrix Virtual Apps and Desktops, and Gateway data sources
If the user logs on from two locations that are too far apart to travel within the elapsed time, Citrix Analytics detects this activity as an impossible travel scenario and triggers the Impossible travel risk indicator. For more information about the Impossible travel risk indicators, see the following articles:
-
Citrix Content Collaboration risk indicators
-
Citrix Virtual Apps and Desktops and Citrix DaaS risk indicators
May 17, 2022
Virtual Apps and Desktops is renamed to Apps and Desktops
On the Security Analytics dashboards and reports and in the data sent by Security Analytics to your SIEM service, all the Virtual Apps and Desktops labels are now updated as Apps and Desktops to align with the rebranded product name.
For example, on the Data Sources page, the Virtual Apps and Desktops labels are renamed as Apps and Desktops.
The Apps and Desktops label represents both Citrix on-premises Citrix Virtual Apps and Desktops and Citrix DaaS (formerly Citrix Virtual Apps and Desktops service) in your organization.
Fixed issues
Citrix Analytics does not automatically discover the Citrix DaaS Cloud Monitor or Director sites that are associated with your Citrix Cloud account. [CAS-66801]
April 05, 2022
What’s new
Secure Workspace Access is renamed to Secure Private Access
On the Analytics dashboards and reports, all the Secure Workspace Access labels are now updated as Secure Private Access to align with the rebranded product name.
For example, on the Data Sources page and the Self-service search page, the Secure Workspace Access labels are renamed as Secure Private Access.
March 21, 2022
Fixed issue
-
In the Create Risk Indicator page, auto-suggestions for dimensions and operators do not work if the previous condition of your search query contains a dimension value that is separated by a space.
For example, in the following query, auto-suggestions stop working after you select the city as
San Jose. This issue is now fixed. [CAS-64126]
March 10, 2022
What’s new
Notify administrator email enhancements
-
The email notification for the Notify administrator(s) action now provides the details of the multiple risk indicators associated with a triggered policy.
-
You can view the name, severity level, and the trigger date of each risk indicator associated with the policy.
-
Click View Risk Details to open the user timeline page in Citrix Analytics and view the latest risk indicator that triggered the policy. On the user timeline page, you can also view all the risk indicators triggered for the user.
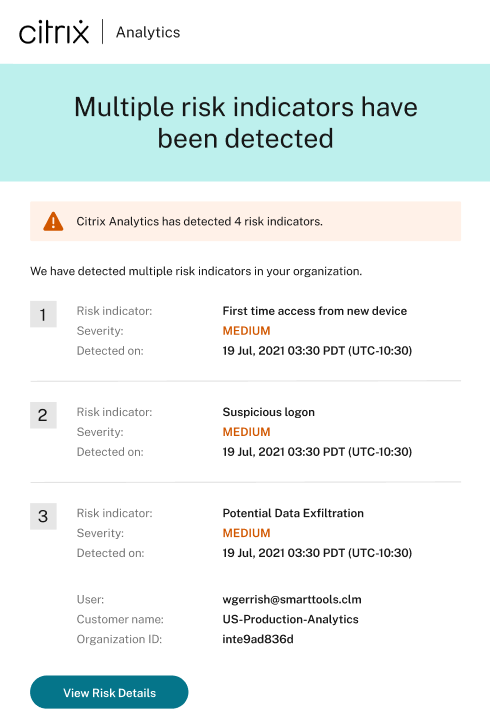
For more information about the Notify administrator(s) action, see Policies and actions.
Fixed issue
Citrix Analytics fails to receive user events from the Secure Workspace Access data source. Therefore, you don’t see the user events in the corresponding self-service search page. Also, you can’t create custom risk indicators for the Secure Workspace Access data source. [CAS-64619]
March 03, 2022
What’s new
Apply request end user response manually
Previously you can apply the Request End User Response action on a user account only by creating a policy. With this release, you can select the action from the Actions list on the user timeline and manually apply this action on a risk indicator.
For more information about the action and how to apply actions manually, see Policies and actions.

Request end user response enhancements for policy
When you create a policy with the Request End User Response action, you see the following enhancements:
-
After selecting Notify administrator(s) as the next action, you can now view the default and the created email distribution lists that you can choose from.
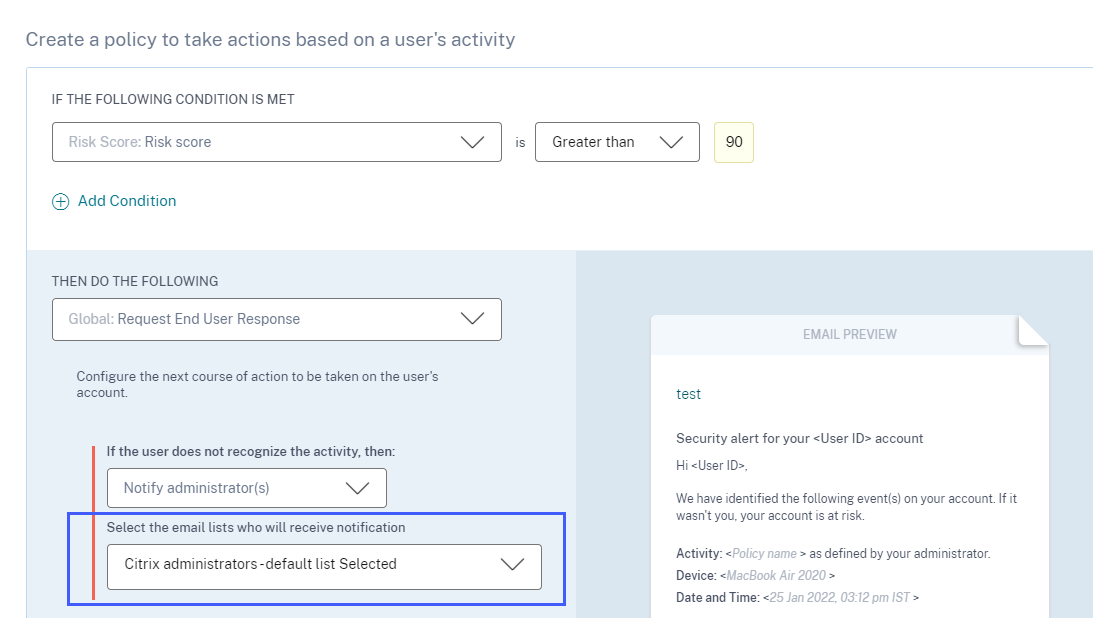
-
You can now select one of the actions from Citrix Content Collaboration or Citrix Virtual Apps and Desktops and Citrix DaaS as the next action. Previously, you can only select one of the Global actions or the Citrix Gateway actions.
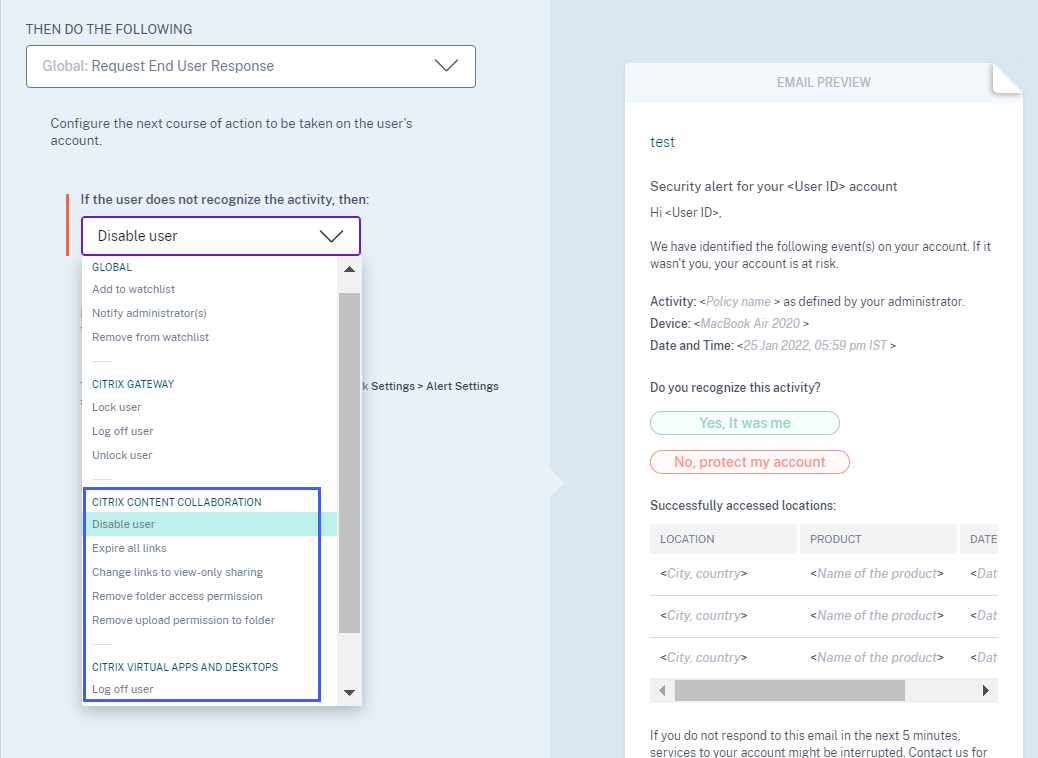
For more information about the action, see Policies and actions.
February 23, 2022
What’s new
Recommended actions for a risk indicator
Citrix Analytics suggests you to apply actions such as Notify administrator(s), Add to watchlist, and Create a policy when the following risk indicators are triggered for a user:
-
Unusual authentication failure (Content Collaboration data source)
-
Unusual authentication failure (Gateway data source)
-
Suspicious logon (Citrix Virtual Apps and Desktops and Citrix DaaS data source)
When you go to the user timeline and select the risk indicator, you can view all the suggested actions in the RECOMMENDED ACTION section.
For example, in the Unusual authentication failure risk indicator, you can view the following recommended actions:
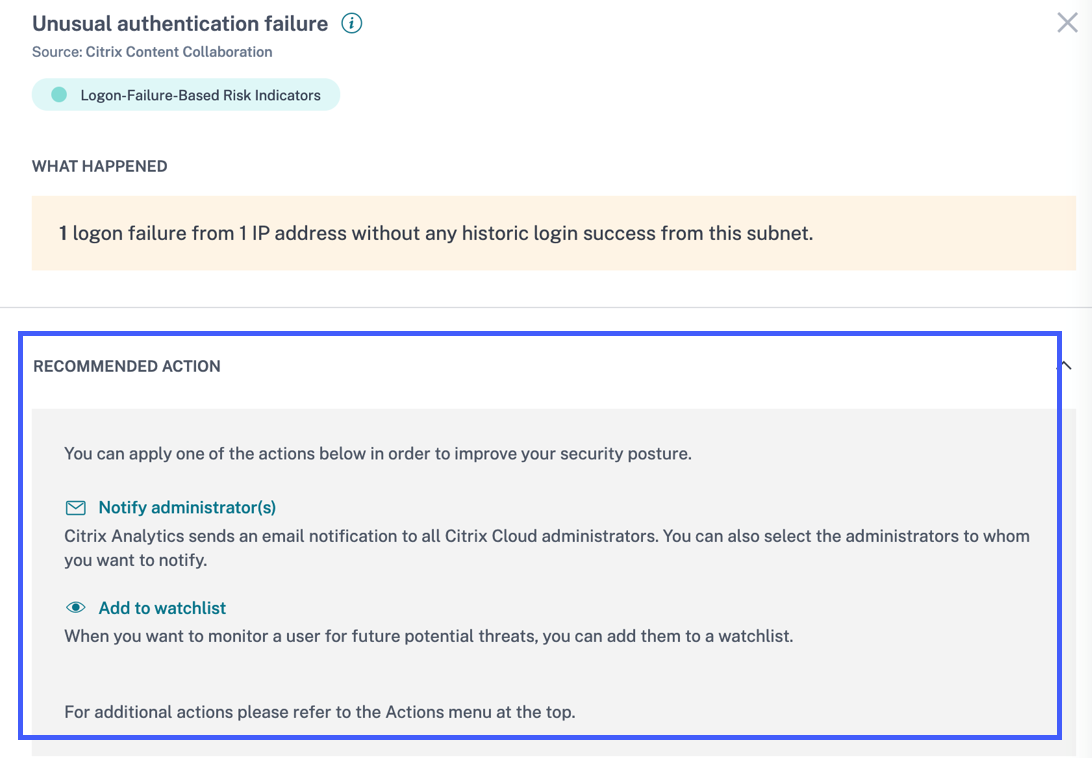
This feature provides guidance to choose an action that you can take depending on the severity of the risk posed by the user. However, you can also take an appropriate action that is outside the recommended list and depending on your risk analysis.
Fixed issue
- If your organization is onboarded to Citrix Cloud in the Asia Pacific South home region, then Citrix Analytics might not receive user events from the Authentication data source. Therefore, you might not see the user events in the corresponding self-service search page. This issue is fixed. [CAS-62300]
February 17, 2022
What’s new
Improved data collection and reporting for the Citrix Virtual Apps and Desktops and Citrix DaaS data source
With this release, you see the following changes:
-
Improvements in data collection, correlation, and reporting of events from Citrix Workspace app clients and Citrix Monitor service.
-
Improvements in the quality of events received from users and client versions, which can be used for the self-service search, custom risk indicators, and overall risk detection.
Support for contextual templates for the session events and the app events in Content Collaboration
On the self-service search page, you can now view the details of only the relevant fields associated with the file, folder, session, share, and user events. The non-applicable fields for the events are removed.
For example, you can view the following details of the File.Copy events:
-
File ID
-
File Copy ID
-
File Path
-
Destination File Path
-
Stream ID
-
Zone ID
These details help you during the risk investigation and analysis of a user account associated with a risky behavior. You can drill down to the specific attributes of an event that seems to be risky.
For more information about the fields, see Self-service search for Content Collaboration.
February 10, 2022
What’s new
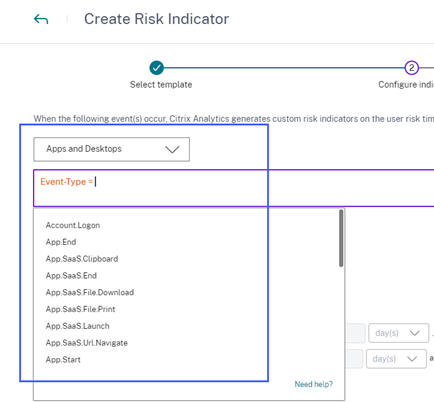
Auto suggested values for the dimensions in the custom risk indicator
In the custom risk indicator page, when you select a dimension and a valid operator in the condition bar, the values for the dimension are shown automatically. Select a value from the auto-suggested list or manually enter a value depending on your use cases. When you type a value, the matching values available in the records are auto-suggested.
The list of values suggested for a dimension is either predefined (known values) in the data base or based on historical events.
For example, when you select the dimension Event-Type and the assignment operator, the known values are auto-suggested. You can select a value depending on your requirement.
For more information, see Custom risk indicators.
February 09, 2022
What’s new
New custom roles for the administrators
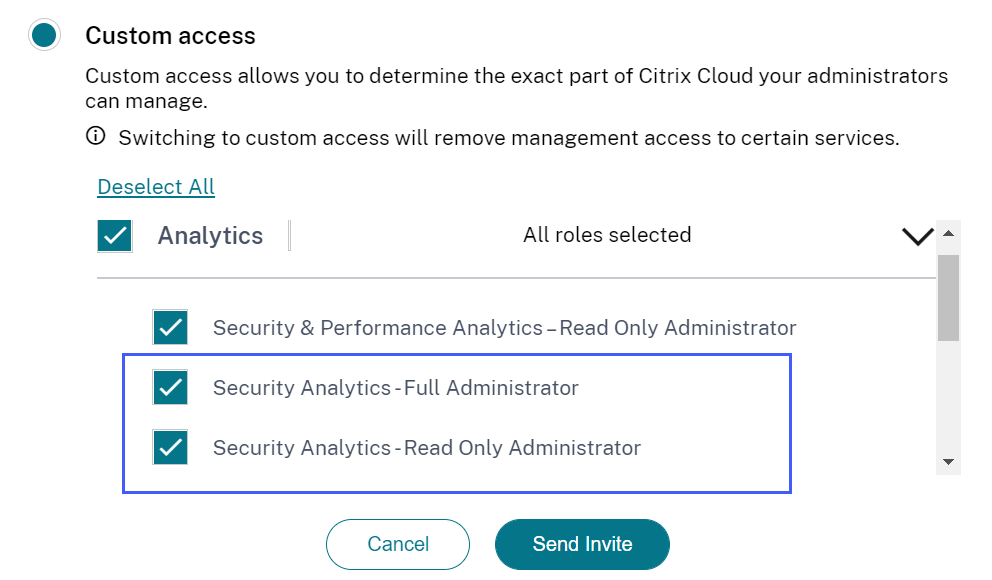
As a Citrix Cloud administrator with full access permission, you can invite other administrators to manage Security Analytics in your organization. You can now assign the following custom roles to the invited administrators:
-
Security Analytics- Full Administrator
-
Security Analytics- Read Only Administrator
Using the custom role, you can provide either read-only or full access permissions to your administrators and allow them to manage the various features of Security Analytics.
For more information about the access permissions for these custom roles, see Manage administrator roles for Security Analytics.
Support for email notifications for custom access administrators
If you are a Citrix Cloud administrator with custom access (read-only or full access) permissions to manage Security Analytics, you now get the following notifications:
-
Weekly notifications about the security risks detected in your organization. For more information, see Weekly email notification.
-
Notifications about the risk indicators when the Notify administrator(s) action is applied manually or triggered by a policy. For more information, see Policies and action.
January 28, 2022
What’s new
Introducing Suspicious Logon risk indicators for Content Collaboration and Gateway data sources
Citrix Analytics for Security now detects user logons that are suspicious in nature based on multiple contextual factors such as:
-
The location is deemed unusual with respect to the user and the organization history
-
The device is deemed unusual with respect to the user and the organization history
-
The network is deemed unusual with respect to the user and the organization history
-
The IP address is deemed suspicious based on the IP threat intelligence feeds
When a user logs on from a suspicious context based on the combination of these factors, the risk indicator is triggered.
This risk indicator replaces the Access from an unusual location risk indicator associated with the Citrix Content Collaboration and Citrix Gateway data sources. Any existing policies that are based on the Access from an unusual location risk indicator are automatically linked to the new risk indicator- Suspicious Logon.
For more information about the risk indicators, see Suspicious logon- Content Collaboration and Suspicious logon- Gateway.
For more information about the schema of the risk indicators, see Citrix Analytics data format for SIEM.
January 20, 2022
What’s new
Microsoft Azure Active Directory integration
You can now connect your Azure Active Directory with Citrix Analytics for Security to:
-
Import the user details and the user groups from your organization’s domain to Citrix Analytics for Security.
-
Enrich the user profiles with additional details such as job title, organization, office location, email, and contact details, which help you during risk investigation and analysis.
For more information, see Azure Active Directory integration.
January 18, 2022
What’s new
Support for the share link actions on all Content Collaboration risk indicators
Previously, you can apply the share link actions- Expire all links and Change link to view-only sharing on the following share link-based risk indicators associated with the Content Collaboration service:
-
Anonymous sensitive share link download
-
Excessive share link downloads
-
Excessive file sharing
With this release, you can now apply the share link actions on the following user-based risk indicators associated with the Content Collaboration service:
-
Access from an unusual location
-
Excessive access to sensitive files
-
Excessive file uploads
-
Excessive file downloads
-
Excessive file or folder deletion
-
Malware files detected
-
Ransomware activity suspected
-
Unusual authentication failures
You can also apply the share link actions on the custom risk indicators associated with the Content Collaboration service.
For more information about the actions and the risk indicators, see the following articles:
-
Content Collaboration risk indicators
Integration with SIEM is now generally available
You can integrate Citrix Analytics for Security with your Security Information and Event Management (SIEM) services and export the users’ data from the Citrix IT environment to your SIEM. The integration helps you to correlate the data collected from various sources and get a holistic view of your organization’s security.
Currently, you can integrate Citrix Analytics for Security with the following services:
-
Splunk
-
Microsoft Sentinel
-
Elasticsearch
-
Other SIEM services by using Kafka or Logstash based data connector
For more information, see Security Information and Event Management (SIEM) integration.
December 23, 2021
What’s new
Share link risk indicators enhancements
Following enhancements are made:
-
You can now create a policy with the Anonymous sensitive share link download risk indicator.
-
The Anonymous sensitive share download risk indicator is renamed as Anonymous sensitive share link download to distinguish it as a share link risk indicator.
-
The Excessive downloads risk indicator is renamed as Excessive share link downloads to distinguish it as a share link risk indicator and to differentiate it from the user-based Excessive file downloads risk indicator.
For more information, see Citrix share link risk indicators.
December 21, 2021
What’s new
Send notifications about risk indicators to your non-Citrix Cloud administrators
You can now notify the non-Citrix Cloud administrators in your organization with the Notify administrator(s) action.
To notify these administrators, create an email distribution list. Select the administrators in the email distribution list either from the external domains that are connected to Citrix Cloud or by using their email addresses directly. When applying the Notify administrator(s) action, select the email distribution list that contains the non-Citrix Cloud administrators.
For more information, see Email distribution list.
December 20, 2021
What’s new
Send user response notifications to your Content Collaboration users
In addition to your Active Directory users, you can now apply the Request End User Response action to your Content Collaboration users.
This action sends email notifications to the users when Citrix Analytics detects any unusual activities in their Citrix accounts. For more information about the Request End User Response action, see Policies and actions.
Access Control is renamed to Secure Workspace Access
On the Security Analytics dashboards and reports, all the Access Control labels are now updated as Secure Workspace Access to align with the rebranded product name.
For example, on the Data Sources page, Self-service search page, and Policies page, the Access Control labels are renamed as Secure Workspace Access.
Fixed issue
- For the Apps and Desktops data source, when you download the search report as a CSV file, some field values in the CSV file are shown as not available (N/A) although their values are available. For example, the values of the fields such as
Download File Name,Session Launch Type, andWorkspace App Versionare shown on the Self-service search page, but in the downloaded CSV file, you see these values as not available (N/A). This issue is now fixed. [CAS-62299]
December 09, 2021
What’s new
Create your custom risk indicators easily with templates
You can now select a template based on your use case and create a custom risk indicator. The templates guide you by providing predefined queries and parameters. It eases your effort while creating a custom risk indicator.
For more information, see Custom risk indicators.
December 07, 2021
Fixed issue
- On Citrix Analytics for Security, you don’t receive the events of the users who are using the Citrix Secure Browser that was released on September 2021. The issue exists because the Hostname tracking policy is not visible in the Citrix Secure Browser post release September 2021 and therefore can’t be enabled to integrate with Citrix Analytics for Security. This issue is now fixed. [CAS-62254]
December 02, 2021
What’s new
Malware files detected risk indicator
You can now get an alert when a user uploads an infected file in Content Collaboration.
The risk indicator detects a file that is infected by a malware such as trojan, virus, or any other malicious threats. It provides visibility into the details of the malicious file such as the file owner, virus name, and the file location.
The risk factor associated with the Malware files detected risk indicator is the File-based risk indicator.
For more information on the risk indicator and the actions that you can apply, see the Malware files detected risk indicator.
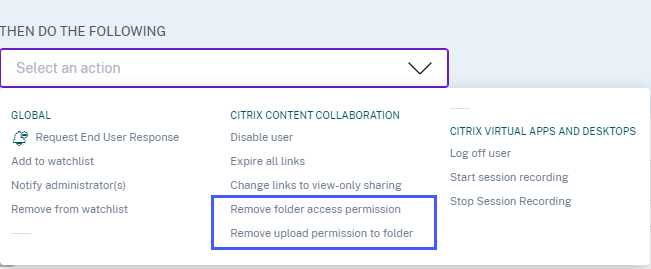
New actions for Content Collaboration data source
You can apply the following actions when the Malware files detected risk indicator is triggered for a user:
-
Remove folder access permission. You can block the access permission of the user who uploads the infected file. The user cannot access the folder where the infected file was uploaded.
-
Remove upload permission to folder. You can block the upload permission of the user who uploads the infected file. The user cannot upload a file to the folder where the infected file was uploaded.
For more information about the actions for Content Collaboration, see Policies and actions.
November 29, 2021
What’s new
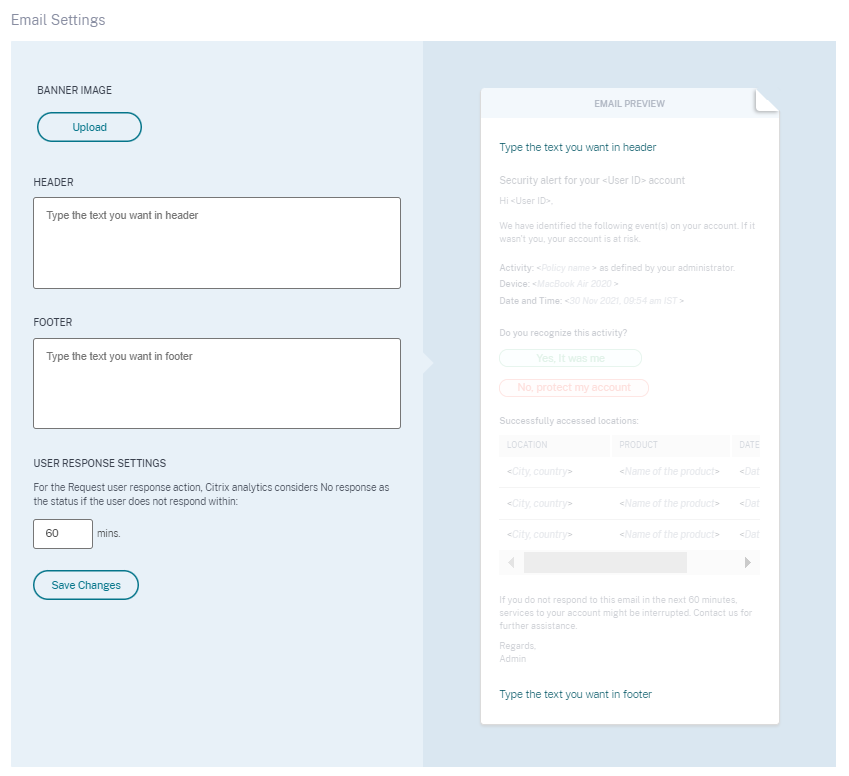
Email settings enhancements for user notifications
As an administrator, you can now add banner image, header, and footer text in the user-response email template. These fields enhance the legitimacy of your email, thus increasing the users’ attention and responses towards your email.
For more information, see End user email settings.
November 26, 2021
What’s new
Custom risk indicators and policies menu changes
The navigation links of the following features are updated:
-
Custom risk indicators: Use this feature by clicking Security > Custom Risk Indicators.
-
Policies: Use this feature by clicking Security > Policies.

November 25, 2021
What’s new
Security Information and Event Management (SIEM) integration enhancements
Note
This integration is in preview.
You can now integrate Citrix Analytics for Security with the following SIEM services:
-
Microsoft Sentinel
-
Elasticsearch with visualization services such as Kibana and SIEM service such as LogRythm
-
Any other SIEM services using the Logstash data collection engine
Depending on your business needs, import the users’ data from Citrix Analytics for Security to your SIEM service. This integration enables your Security Operations teams to correlate, analyze, and search data from disparate logs within the SIEM services in your organization, helping them to identify and quickly remediate the security risks.
For more information, see Security Information and Event Management (SIEM) integration.
November 09, 2021
Fixed issue
- On few tenants, the user policies are not working. This issue occurred when the alerts for the virtual apps have empty string values for the domains. This issue is now fixed. [CAS-60920]
November 02, 2021
What’s new
View access profiles and logon details of the Citrix Virtual Apps and Desktops and Citrix DaaS users
On the Access Assurance Location dashboard, you can view the access profiles and the logon details of the users who have logged on to virtual apps and virtual desktops. This information helps you during threat investigation and analysis.
-
The Access Profile page provides the summary of the user accesses from the selected locations. You can view the trend analysis and top access events of the total users and the unique users logons.
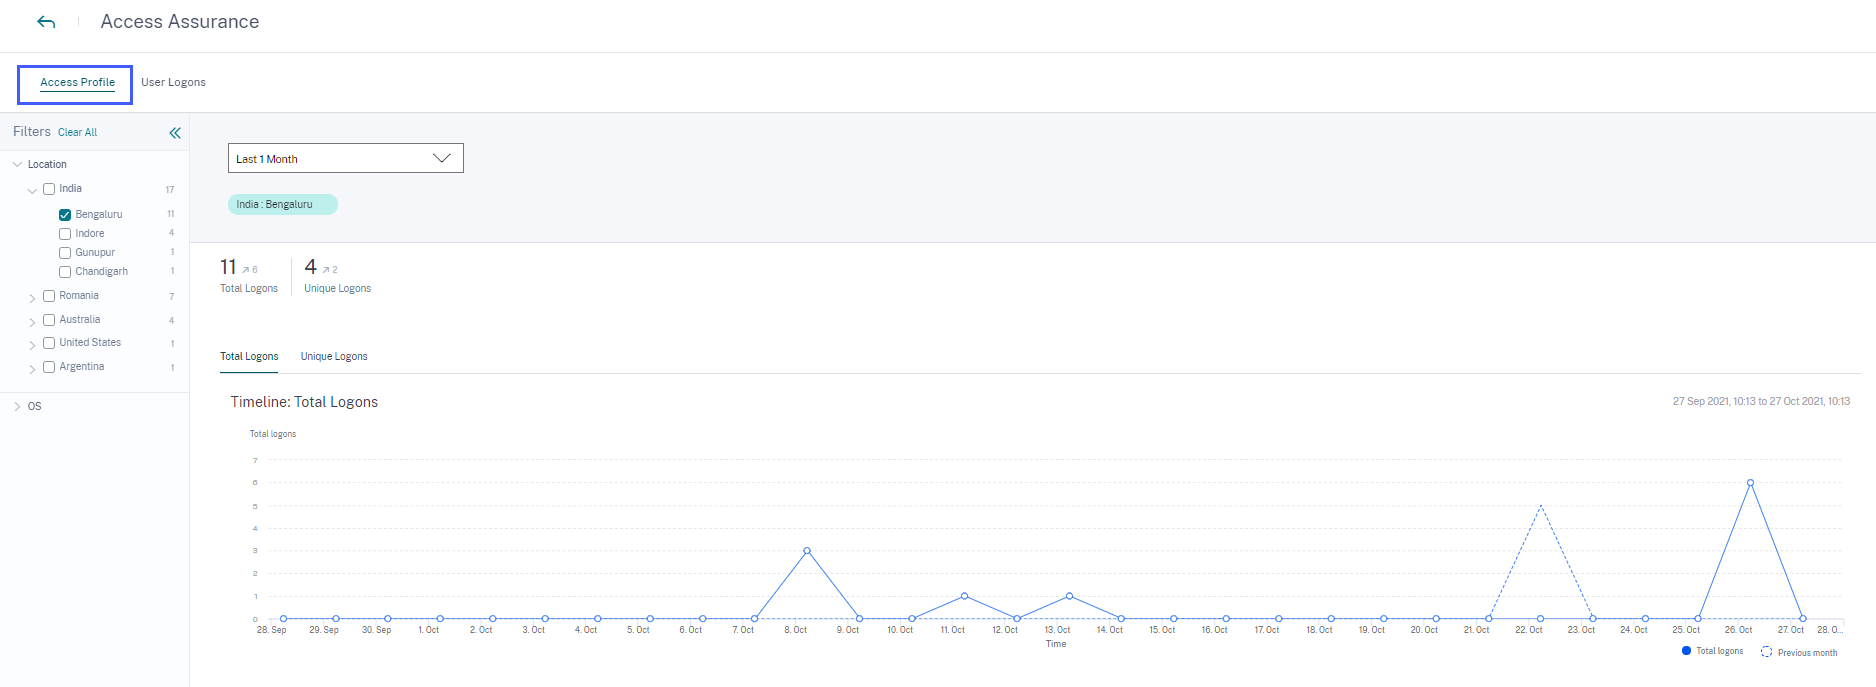
-
The User Logons page provides the details of the user logons to virtual apps and virtual desktops from the selected locations.
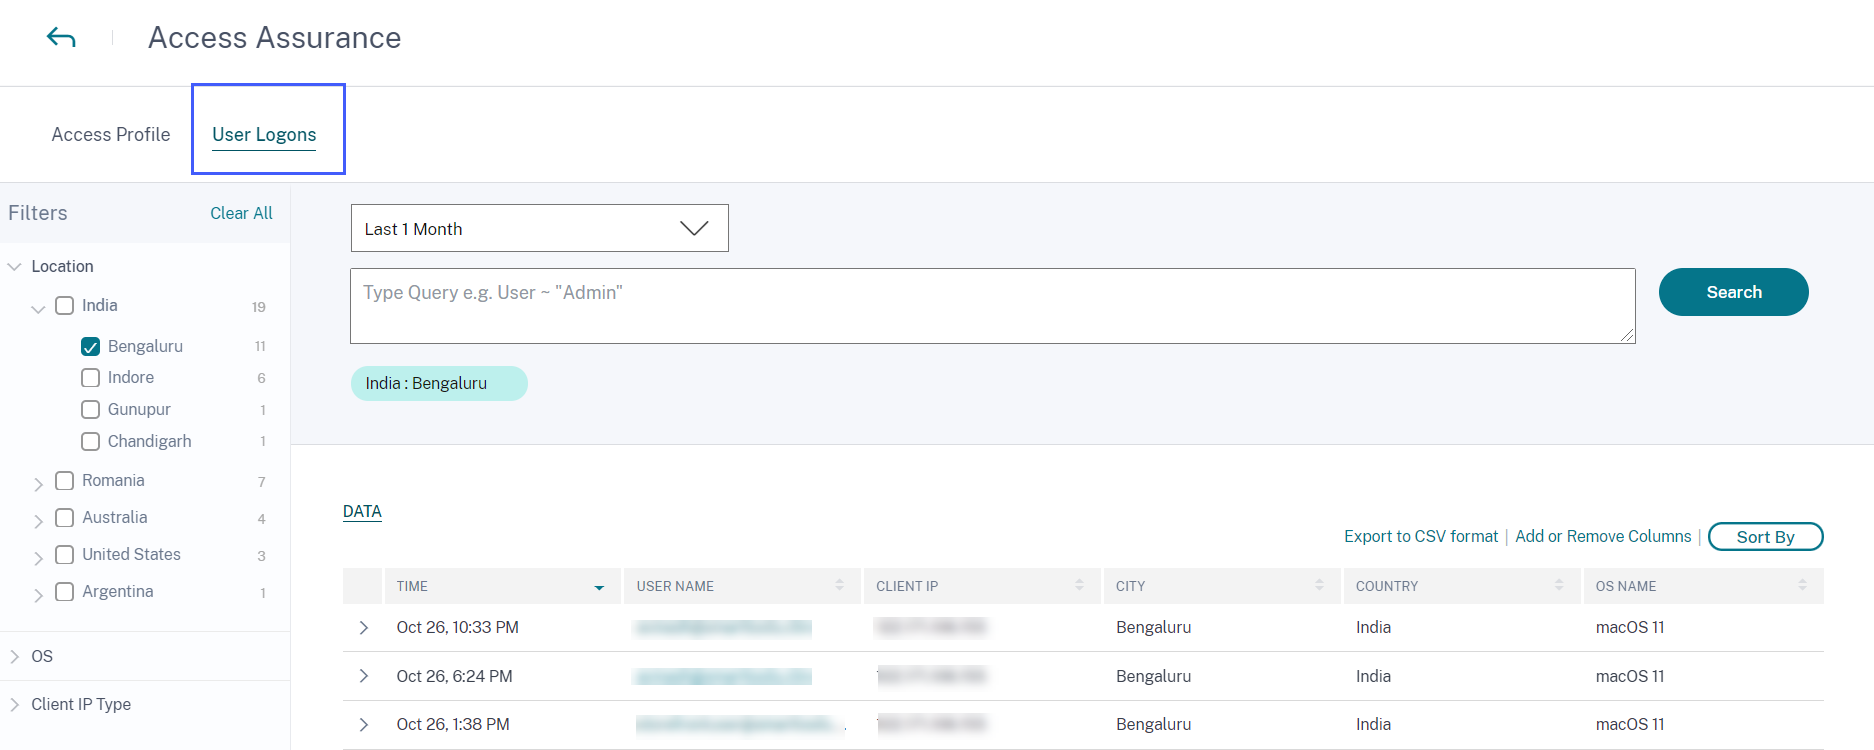
For more information, see the Access Assurance Location dashboard.
View malware logs on the self-service search page for Content Collaboration
On the self-service page for Content Collaboration, you can now view the malware event File.VirusInfected and its associated logs. This event is triggered when a Content Collaboration user uploads a file that is infected with a malware.
For more information, see Self-service search for Content Collaboration

Fixed issue
- A few Content Collaboration users are incorrectly set as non-employees while processing the events in Citrix Analytics. Therefore, the users are not identified as Discovered users. This issue is now fixed. [CAS-59608]
October 20, 2021
What’s new
Session Recording server integration
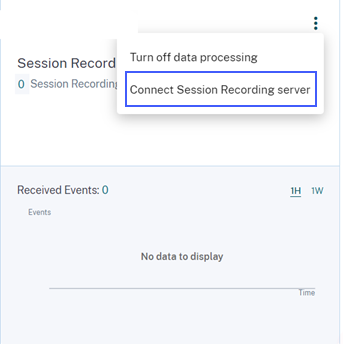
For your Citrix Virtual Apps and Desktops and Citrix DaaS deployment, you can now configure your Session Recording servers to send the user events to Citrix Analytics for Security. These user events are processed to provide actionable insights into users’ behavior.
On the Data Sources > Security page, go to the Virtual Apps and Desktops site card. On the Session Recording site card, click vertical ellipsis (⋮) and then select Connect Session Recording Server.
For more information, see Connect to Session Recording deployment.
October 19, 2021
What’s new
Notify administrator email template enhancements
The email notification that an administrator receives after applying the Notify administrator(s) action is enhanced to provide better insights into the user risky events.
-
The notification now provides detailed information about the triggered risk indicator or the applied policy. For example, you can view the severity and triggered time of the default and custom risk indicators. The content structure is improved for better readability.
-
The administrators can now access the user timeline directly from the email notification and view details about the risky events.
-
A feedback option is added in the notification. This option helps to collect the responses from the administrators and continuously improve the content of the notification based on the responses.
For more information about the Notify administrator(s) action, see Policies and actions.
User log on summary enhancements
-
You can now view the upward or downward trend of the user logons for the world wide total user logons and world wide unique user logons.

-
The DEVIATION column on the Unique Logon Locations table shows the upward or downward change in the unique user logons for a particular location.
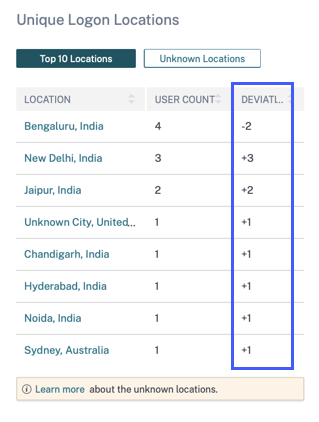
These metrics help you to understand how the user logons have changed (positive or negative) from the previous period. It provides visibility into the user interactions with your Citrix Virtual Apps and Desktops and Citrix DaaS deployments.
For more information, see Access assurance location dashboard.
Fixed issue
- On the Access Assurance Location dashboard, the User Logon Summary cards fail to display the user logon metrics (worldwide total user logons, worldwide unique user logons, and countries have user logons) when no users log on from outside the geofence areas. This issue is now fixed. [CAS-59595]
October 01, 2021
What’s new
View audit logs on the self-service search for Content Collaboration
On the self-service search for Content Collaboration, you can now view the audit logs. These logs provide insights into the permissions and the actions applied on the user accounts by the Content Collaboration administrators. Using these data, you can verify if the Content Collaboration administrators have taken valid actions on their user accounts. As a security administrator, it helps you during risk investigation and analysis.
For more information on audit logs, see Self-service search for Content Collaboration.
Fixed issue
The administrators who log on to Citrix Cloud by using Azure AD are unable to access the Citrix Analytics service when the previous expired session ID comes along with the new session ID. This issue is now fixed. [CAS-59385]
September 29, 2021
What’s new
Access assurance location dashboard is now generally available
The dashboard provides visibility into the locations of your Citrix Virtual Apps and Desktops and Citrix DaaS users. You can identify the users whose locations are unusual by enabling geofencing and apply appropriate actions to prevent any threats.
To view the dashboard, click Security > Access Assurance. Select the time period for which you want to view the location details.
For more information, see Access assurance location dashboard.
September 15, 2021
What’s new
Custom risk indicator enhancements
-
When a custom risk indicator is triggered, it gets displayed on the user timeline immediately. However, the risk summary and the risk score of the user get updated after a few minutes (approximately 15- 20 minutes).
-
If you modify the attributes such as condition, risk category, severity, and name of an existing custom risk indicator, on the user timeline, you can still view the previous occurrences of the custom risk indicator (with the old attributes) that were triggered for the user.
-
If you delete a custom risk indicator, on the user timeline, you can still view the previous occurrences of the custom risk indicator that were triggered for the user.
For more information, see Custom risk indicators.
September 14, 2021
What’s new
Introducing Suspicious Logon risk indicator
Citrix Analytics for Security now detects user logons that are suspicious in nature based on multiple contextual factors such as:
-
The location is deemed unusual with respect to the user and the organization history
-
The device is deemed unusual with respect to the user and the organization history
-
The network is deemed unusual with respect to the user and the organization history
-
The IP address is deemed suspicious based on the IP threat intelligence feeds
When a Citrix Virtual Apps and Desktops and Citrix DaaS user logs on from a suspicious context based on the combination of these factors, the risk indicator is triggered.
This risk indicator replaces the Access from an unusual location risk indicator associated with the Citrix Virtual Apps and Desktops data source. Any existing policies that are based on the Access from an unusual location risk indicator are automatically linked to the new risk indicator- Suspicious Logon.
For more information about the risk indicator, see Citrix Virtual Apps and Desktops and Citrix DaaS risk indicators.
SIEM messages enhancement
Citrix Analytics for Security now send the schema details of the Suspicious logon risk indicator to your SIEM service. You can view the schema of the indicator summary and the event details of the Suspicious logon risk indicator. For more information, see Citrix Analytics data format for SIEM.
Fixed issue
- For the Apps and Desktops self-service search, the client IP value is missing in the downloaded CSV file. This issue is now fixed. [CAS-58426]
August 19, 2021
What’s new
Introducing Citrix Analytics App for Splunk
Note
The app is in preview.
Citrix Analytics App for Splunk enables you to view the data collected from Citrix Analytics for Security in the form of insightful dashboards on your Splunk. The dashboards provide insights into the risky events of your users. You can also correlate the Citrix Analytics data with logs collected from various other data sources. Correlation helps you to find relations between events and take timely actions to protect your IT environment.
To download the app, go to Splunkbase. Install the app on your Splunk search head.
For more information, see Citrix Analytics App for Splunk.
Custom risk indicator schema for SIEM
In your SIEM service, you can now view the schema of the custom risk indicators created for Citrix Virtual Apps and Desktops and Citrix DaaS. This data helps you to gain insight into your organization’s security risk posture.
For more information about the custom risk indicator schema, see Citrix Analytics data format for SIEM.
Support for Citrix Director as a data source
You can now configure your on-premises sites on the Citrix Director to send events to Security Analytics. These events are used to discover the users connected to Security Analytics and determine the Workspace app versions installed on the users’ devices.
By default, the data processing is enabled after the discovery of the sites. On the Monitoring card, you can view all the connected sites.
For more information on how to configure your sites on the Director, see Citrix Virtual Apps and Desktops and Citrix DaaS data source.
Support for geofence in the Access assurance location dashboard
You can now use the Geofence Settings in the dashboard to select and enable the geofenced areas. After enabling the geofence, the map displays the geofenced areas (countries) and the user logons from outside and inside the geofence. This feature uses the CVAD-Session started outside of geofence risk indicator to monitor the user logons.
For more information, see Access assurance location dashboard.
Workspace app status on the Users page
On the Users page, you can now view the status of the Citrix Workspace app clients that are supported by Citrix Analytics. The page shows the following status:
- Supported
- Partially supported
- Unsupported
- Not Available
- Inactive
The status helps you to identify any unsupported client versions used by the users and recommend the users to upgrade their clients to a supported version. A supported client version sends the user events to Citrix Analytics.
Note
To view the Citrix Workspace app status, you must onboard your Citrix Director data source. Otherwise, the status for every Citrix Virtual Apps and Desktops and Citrix DaaS user is shown as Inactive.
For more information, see the Users dashboard.
Support for the IS EMPTY operator
While creating a custom risk indicator, you can now use the IS EMPTY operator in your condition to check for null or empty dimension.
Note
The operator works for only string-type dimensions such as App-Name, Browser, and Country.
For more information, see Custom risk indicators.
Improved risk scoring
On the user’s timeline, you can now view the risk summary of a user. The risk summary provides information about the risk factors associated with user events. The risk factor helps you to identify the type of anomalies in the user events and also determines the risk score. The following are the risk factors:
-
Device-based risk indicators
-
Location-based risk indicators
-
IP-based risk indicators
-
Logon-failure-based risk indicators
-
Data-based risk indicators
-
File-based risk indicators
-
Custom risk indicators
-
Other risk indicators
On the user’s timeline, you can now apply the filter to view the user events based on the risk factors.
For more information, see the following topics:
July 29, 2021
Deprecated feature
Deprecated actions associated with Citrix Endpoint Management™
The following actions are removed from the Citrix Endpoint Management data source. You can no longer apply these actions on the risk indicators or create policies using these actions.
-
Lock device
-
Notify Endpoint Management admin
-
Notify user
-
Revoke device
-
Wipe device
In your existing policies, if these actions are already in use, they are automatically replaced by the Add to watchlist action. And you can monitor such users from the watchlist.
July 14, 2021
What’s new
Support for the IS NOT EMPTY operator
While creating a custom risk indicator, you can now use the IS NOT EMPTY operator in your condition to check if the dimension is not empty (not blank).
Note
The operator works for only string-type dimensions such as App-Name, Browser, and Country.
For example, the following condition detects user logon events from any country where the country value is not null. In other words, the country name is specified.
Event-Type = “Session.logon” AND Country IS NOT EMPTY
For more information, see Custom risk indicators.
July 06, 2021
What’s new
View non-risky users on the Users dashboard
On the Users dashboard, you can now view the number of non-risky users for the selected time period. These discovered users are identified as non-risky based on the zero risk score for the selected period. Click the Non Risky Users card to view all the users that have zero risk score.
For more information, see Users dashboard.

July 01, 2021
What’s new
Access assurance location dashboard enhancements
-
On the Top 10 Unique Logon Locations table, you can view the number of unique user logons from unknown locations. This list is a subset of the top 10 unique logon locations. You can also find the reasons why the locations are unknown and the possible ways to get the users’ locations.
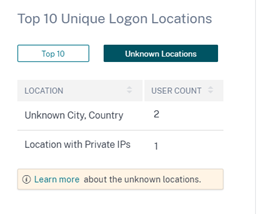
-
On the Access Location page, if you select multiple locations, you can view and compare the timeline details of user logons from all locations, top five locations, and bottom five locations.
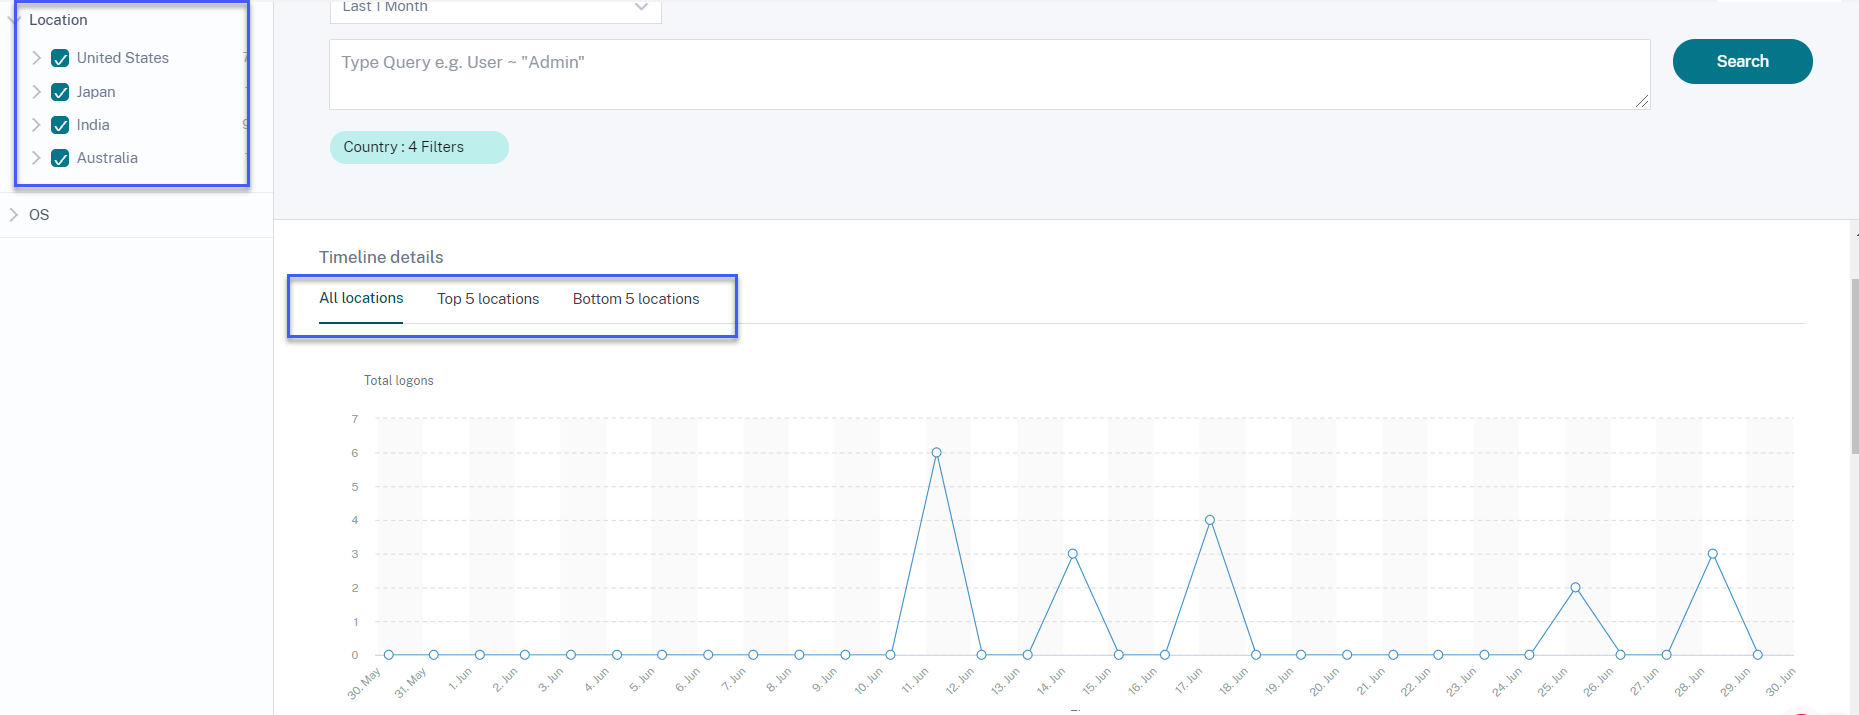
-
On the Access Location page, you can use the nested facets such as country and their cities, operating systems- major and minor versions. These facets enable you to filter the events in a granular way.
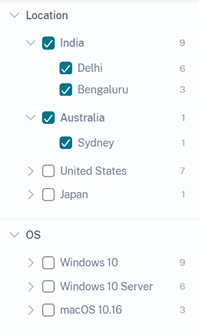
For more information, see Access assurance location.
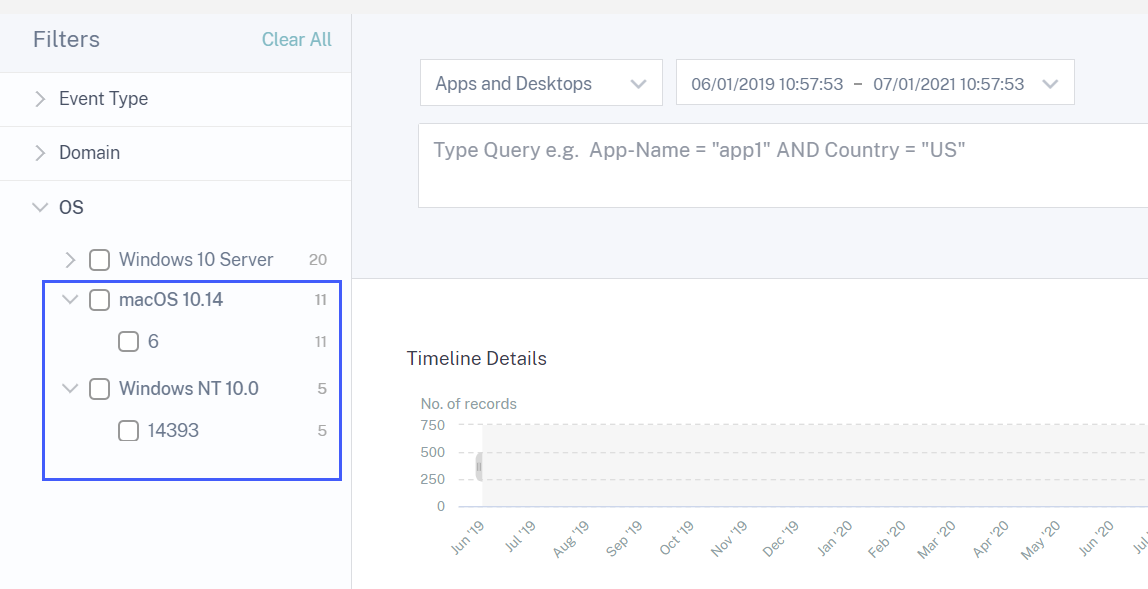
Updated the OS facet in self-service search for Virtual Apps and Desktops
You can now filter the Apps and Desktops events using the nested OS facet. Select the major version and the minor version associated with an operating system and filter the events in a granular way. For more information, see Self-service search for Apps and Desktops.
June 30, 2021
What’s new
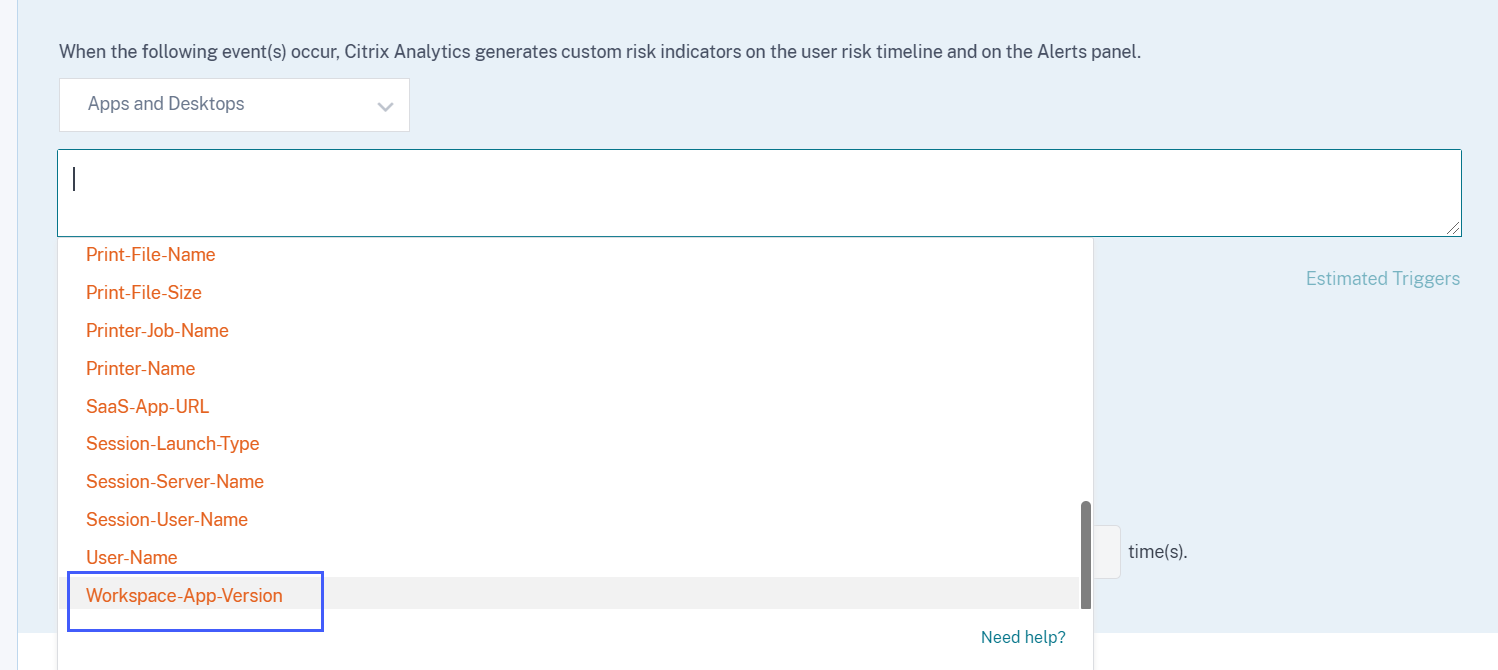
Added Workspace app version in custom risk indicator condition for Apps and Desktops
For the Apps and Desktops data source, you can now use the Workspace-App-Version dimension to define your condition while creating a custom risk indicator. For more information on the dimension, see Self-service search for Apps and Desktops.
June 23, 2021
What’s new
SIEM messages enhancements
The following fields are now added to the schema of the risk indicators:
-
indicator_vector_name- Indicates the risk vector associated with a risk indicator. The risk vectors are Device-based Risk Indicators, Location-based Risk Indicators, Logon-failure-based Risk Indicators, IP-based Risk Indicators, Data-based Risk Indicators, File-based Risk Indicators, and Other Risk Indicators. -
indicator_vector_id- The ID associated with a risk vector. ID 1 = Device-based Risk Indicators, ID 2 = Location-based Risk Indicators, ID 3 = Logon-failure-based Risk Indicators, ID 4 = IP-based Risk Indicators, ID 5 = IP-based Risk Indicators, ID 6 = Data-based Risk Indicators, ID 7 = Other Risk Indicators, and ID 999 = Not available.
For more information, see Citrix Analytics data format for SIEM.
June 07, 2021
What’s new
Enhancements to the notify administrator(s) action
When you apply the Notify administrator(s) action to a risk indicator or create a policy with the action, you can now select the administrators who receive notification about the user’s risky behavior. For more information on the action, see Policies and actions.
Added support for the view-only sharing action
If a user shares files excessively, Citrix Analytics triggers the Excessive file sharing risk indicator. From the user’s risk timeline, you can now apply the Change links to view-only sharing action to the Excessive file sharing risk indicator. You can also apply the action on a particular share link on the share link risk timeline. This action prevents other users from downloading, copying, or printing the files associated with the share links. For more information about the action, see Policies and actions.
May 18, 2021
What’s new
Migrating the default risk indicators to custom risk indicators
The following default risk indicators are migrated to preconfigured custom risk indicators.
| Default risk indicator | Data source | Preconfigured custom risk indicator |
|---|---|---|
| First time access from new device | Citrix Virtual Apps and Desktops and Citrix DaaS | CVAD-First time access from new device |
| First time access from new IP | Citrix Gateway | Gateway-First time access from new IP |
With this migration to the custom risk indicators, the default risk indicators and the associated machine learning algorithms are deprecated.
The corresponding custom risk indicators are triggered based on the following preconfigured conditions:
-
When a user access from a new device for the first time or an existing device that has not been used for a minimum 90 days.
-
When a user signs in from a new IP address for the first time or an existing IP address that has not been used for a minimum 90 days.
Along with the preconfigured conditions, you can now add your own conditions for these custom risk indicators to identify the threats in your Citrix environment. This option gives you flexibility to configure the custom risk indicator based on your security needs. You can also create policies to apply actions on the risky events detected by these custom risk indicators.
However, on the user’s time line, you can still view the previously triggered default risk indicators and their events.
The policies associated with these default risk indicators are automatically linked to the corresponding preconfigured custom risk indicators.
For more information, see Preconfigured custom risk indicators and policies.
Enhancements in self-service search for Gateway
-
The Event Type filter is now renamed to Record Type. Select one of the following record types to filter your events- VPN_AI, VPN_IF, and, VPN_ST.
-
On the DATA table, expand a row for a user event to view the corresponding event type. The event types can be one the following- Authentication, ICA® File, or Session Logout.
The following table describes the correlation between the record types and the event types.
| Record type | Event type |
|---|---|
| VPN_AI | Authentication |
| VPN_IF | ICA File |
| VPN_ST | Session Logout |
For more information, see Self-service search for Gateway.
Fixed issue
-
Custom risk indicator gets triggered based on the case sensitivity of the conditional values. For example, in the user events containing device IDs in the allowed list, you see the following behavior:
-
If you enter the value of the
Device-IDdimension in the lower case, the custom indicator gets triggered.Event-Type = Session.Logon AND Device-ID NOTIN (“1621d2cb-f598-5ef7-a5bf-81747496ed2e”) -
If you enter the value of the
Device-IDdimension in the upper case for the same device, the custom indicator does not get triggered.Event-Type = Session.Logon AND Device-ID NOTIN (“1621D2CB-F598-5EF7-A5BF-81747496ED2E”)
This issue is now fixed and the custom risk indicator gets triggered irrespective of the case-sensitivity of the conditional values.
[CAS-50153]
-
April 29, 2021
What’s new
Events details for a custom risk indicator
On the user’s risk timeline page, you can now view the events that triggered a custom risk indicator. Previously, you were able to view only the defined conditions, description, and the trigger frequency for a custom risk indicator. Click Event Search to view the details of the events associated with the user and the risk indicator. For more information, see Custom risk indicators.
Fixed issue
- An administrator is unable to create custom risk indicators even after their access permission is changed from read-only admin to full admin. [CAS-49628]
April 16, 2021
What’s new
SIEM messages enhancements
You can view the following enhancements on the risk indicator schema format:
-
The client IP address is now available in the schema for all the batch risk indicators. Previously the client IP address was available only for a few batch risk indicators:
- EPA scan failure
- Excessive authentication failures
- Logon from suspicious IP
- Access from an unusual location
- Unusual authentication failure
- Anonymous sensitive share download
- Potential data exfiltration
-
If an integer data type field value is unavailable, the value assigned is -999. For example,
"latitide" = -999. -
If a string data type field value is unavailable, the value assigned is NA. For example,
"city"= "NA".
For more information, see Citrix Analytics data format for SIEM.
March 26, 2021
What’s new
Restriction on the SIEM messages
Citrix Analytics sends a maximum of 1000 events details for each risk indicator occurrence to your SIEM service. These events are sent in a chronological order of occurrence. For more information, see Citrix Analytics data format for SIEM.
Added the data source ID and the indicator category ID fields in the SIEM messages
Following fields are added in the indicator summary schema and the indicator event details schema.
| Field | Description |
|---|---|
data_source_id |
The ID associated with a data source. ID 0 = Citrix Content Collaboration, ID1 = Citrix Gateway, ID 2 = Citrix Endpoint Management, ID 3 = Citrix Virtual Apps and Desktops, ID 4 = Citrix Access Control™ |
indicator_category_id |
The ID associated with a risk indicator category. ID 1 = Data exfiltration, ID 2= Insider threats, ID 3 = Compromised users |
For more information, see Citrix Analytics data format for SIEM.
March 18, 2021
What’s new
Access assurance location dashboard
Note
The feature is in preview.
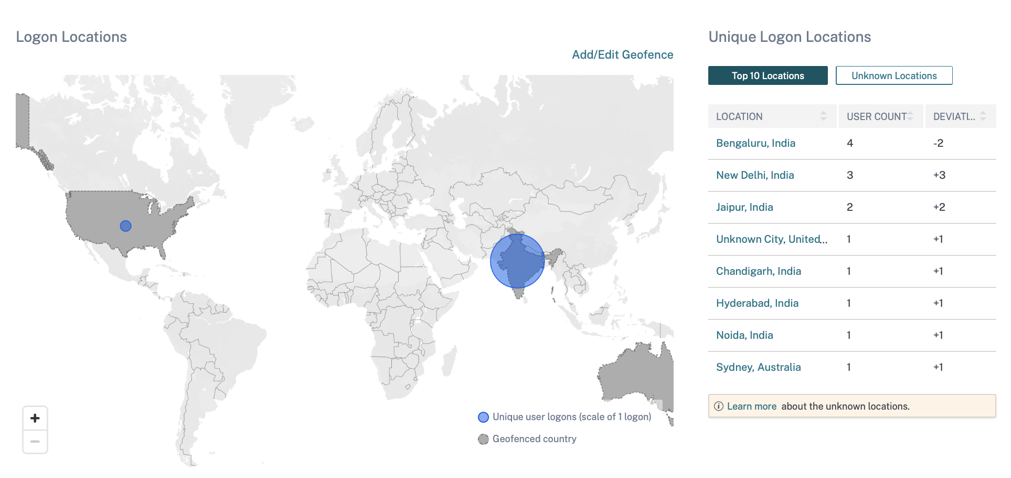
The Access Assurance Location dashboard provides an overview of the locations from where the Citrix Virtual Apps and Desktops and Citrix DaaS users have logged on for a selected period. Citrix Analytics receives these user logon events from Citrix Workspace app installed on the users’ devices.
To view the dashboard, click Security > Access Assurance.
You can view the following information for a selected period:
-
Total number of user logons from a particular location and across the locations.
-
Total number of unique user logons across the locations.
-
Total number of countries from where the users have logged on.
-
Top 10 locations with unique user logons.
For more information, see Access assurance location.
Support for the NOT LIKE (!~) operator
For the self-service search query and the custom risk indicator condition, you can now use the NOT LIKE (!~) operator. The operator checks for the user events for the matching pattern that you have specified. It returns the events that do not contain the specified pattern anywhere in the event string.
For example, the query User-Name !~ “John” displays events for the users except John, John Smith, or any such users that contain the matching name “John”.
For more information, see Self-service search.
Translated operating system version
For the Citrix Virtual Apps and Desktops and Citrix DaaS data source, the Platform dimension is now translated as the OS-Major-Version, OS-Minor-Version, and OS-Extra-Details dimensions. Based on the operating system details of a user, Citrix Analytics displays these dimensions on the self-service search page.
You can use these dimensions to define your conditions for a custom risk indicator.
For the previously created custom risk indicators, if you have used the Platform dimension as a condition, Citrix Analytics automatically replaces the Platform dimension with the OS-Major-Version, OS-Minor-Version, and OS-Extra-Details. This update does not affect the integrity of your defined condition.
For more information on the new dimensions, see Self-service search for Virtual Apps and Desktops.
Updated the data fields for Apps and Desktops
On the Self-service search for Apps and Desktops, view the updated data fields based on the contextual template.
For more information, see Self-service search for Apps and Desktops.
Deprecated feature
Removed the VPN_AF and VPN_SU events from the self-service search page
On the self-service search page for the Citrix Gateway data source, the following record types are now removed.
| Record type | Record name |
|---|---|
| VPN_SU | Session Update record |
| VPN_AF | Application Launch Failure record |
So, you cannot filter and view your events based on these record types. Any custom risk indicators based on these record types stop functioning.
For more information, see Self-service search for Gateway.
March 11, 2021
What’s new
Current timestamp for the user risk score schema
A new field last_update_timestamp is added in the user risk score schema format. This field indicates the time when the risk score was last updated. For more information on the schema format, see User risk score schema.
March 03, 2021
What’s new
Enhancements to the Logon from suspicious IP risk indicator
On the user’s risk timeline page, a new section Suspicious IP is displayed for the Logon from suspicious IP risk indicator. This section provides the following information:
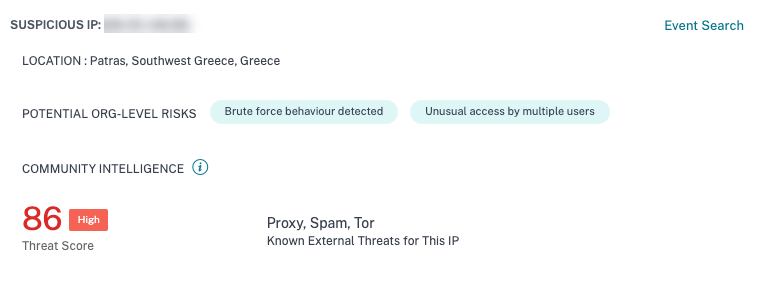
- The IP address from which suspicious sign-in activity is detected.
- The location of the user.
- Any patterns of suspicious IP activity that Citrix Analytics has recently detected in your organization.
- Community-level intelligence feed about the IP address.
For more information, see the Logon from suspicious IP risk indicator.
Enhancements to Access from an unusual location risk indicator
-
In the Access from an unusual location risk indicator for Citrix Content Collaboration, added the TOOL NAME column in the event table. Removed the DEVICE BROWSER column from the event table. For more information, see Citrix Content Collaboration risk indicators.
-
In the Access from an unusual location risk indicator for Citrix Virtual Apps and Desktops and Citrix DaaS, added the DEVICE ID and the RECEIVER TYPE columns in the event table. For more information, see Citrix Virtual Apps and Desktops risk indicators.
Citrix Analytics data format for SIEM
The article describes the schema of the processed data generated by Citrix Analytics for your SIEM service.
Fixed issue
- For a Content Collaboration user, if the
Is Employee<!--NeedCopy-->value is null, then the user is not displayed on the discovered users list. [CAS-47815]
February 18, 2021
What’s new
Support for the first time access from a new entity in the custom risk indicator
You can now create a risk indicator that triggers when Citrix Analytics receives events from a new entity for the first time. Some examples of entities are Client IP, City, and Country.
On the Create Indicator page, click the First time option. Enable the First time for a new button, and select a valid entity from the list based on the data source. You need not assign any specific value to the entity. For example, if you select City from the list, Citrix Analytics triggers a risk indicator whenever users sign in from a new city for the first time.
For more information, see Creating a custom risk indicator.
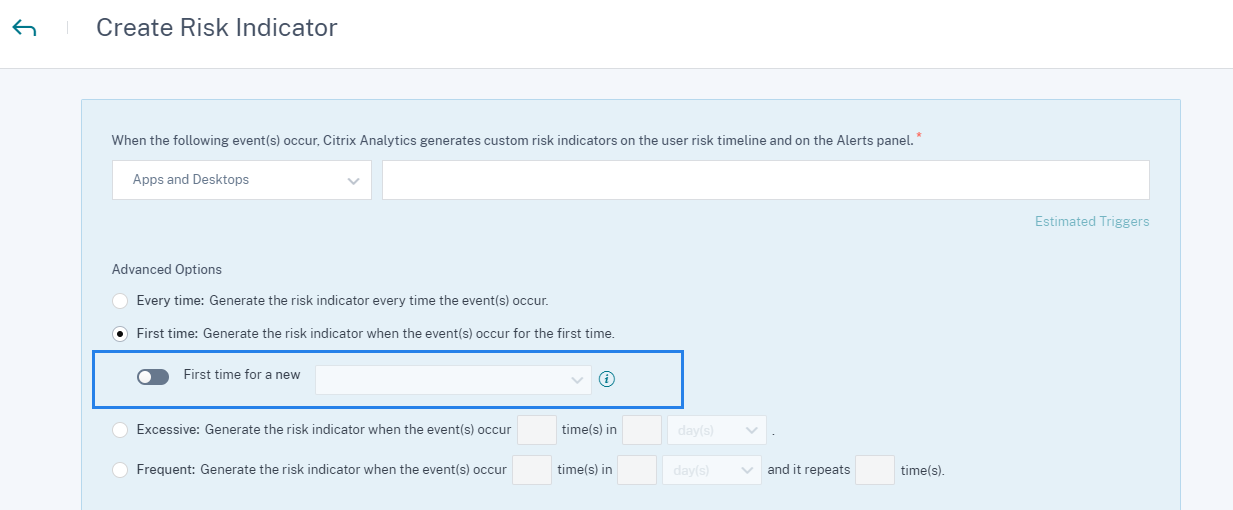
Maximum limit for creating custom risk indicator
You can now create custom risk indicators up to a maximum limit of 50. If you reach this maximum limit, you must either delete or edit any existing custom risk indicator to create a custom risk indicator.
For more information, see Custom risk indicators.
User location data from Citrix Virtual Apps and Desktops and Citrix DaaS
On the User Info page, Citrix Analytics now displays the user’s location from the Citrix Virtual Apps and Desktops and Citrix DaaS data source.
For more information about the user location, see User profile.
Multi-column sorting
On the self-service search page, you can now sort the user events by more than one column. Click Sort By, add the columns, and the sorting order. Click Apply to sort the user events. You can add up to six columns to perform a multi-column sorting.
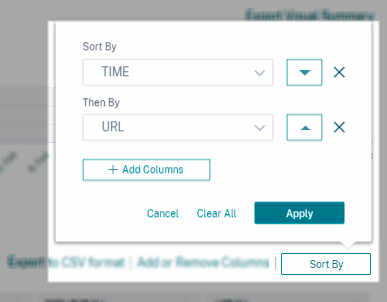
For more information, see Self-service search.
Deprecated features
Excessive authorization failure risk indicator deprecated
The Citrix Gateway risk indicator - Excessive authorization failure has been deprecated. You can only view historic data related to this indicator.
The following changes are applicable as part of this deprecation:
-
Citrix Analytics no longer generates these risk indicators.
-
Citrix Analytics no longer generates policies with these risk indicators as the conditions.
-
Default policies with these risk indicators as the conditions no longer take effect.
For more information, see Citrix Gateway risk indicators.
January 27, 2021
What’s new
Enhancements to the Access from an unusual location risk indicator
For Citrix Content Collaboration, Citrix Gateway, and Citrix Virtual Apps and Desktops, the Access from an unusual location risk indicator is now triggered when the user signs in from an IP address associated with a new country, or a new city that is anomalously far away from any previous sign-in location. Other factors include the user’s overall level of mobility and the relative frequency of sign-ins from the city across all users in your organization. In all cases, user location history is based on the previous 30 days of sign-in activity.
For more information about the risk indicator, see the following topics:
-
Citrix Content Collaboration risk indicators
-
Citrix Virtual Apps and Desktops and Citrix DaaS risk indicators
January 20, 2021
Fixed issue
-
For the Apps and Desktops data source with on-premises StoreFront, the data processing fails although the StoreFront deployment is successfully connected.
[CAS-46656]
January 19, 2021
Fixed issue
-
In the custom risk indicator page, after correcting an invalid condition in the search field, the Estimate Trigger link does not respond.
For example, you type an invalid condition Client-IP = 10.10.10.10. After you correct this condition and type as Client-IP = “10.10.10.10”, the Estimate Trigger link does not respond.
Workaround: Refresh the custom indicator page and then create the custom indicator with a valid condition.
[CAS-46316]
January 13, 2021
What’s new
New version of Citrix Analytics Add-on for Splunk is available
Citrix Analytics Add-on version 2.1.0 for Splunk is now available. Go to the downloads page to download the file.
Added support for Splunk Cloud Inputs Data Manager (IDM) and Splunk 8.1 64-bit
You can now integrate Citrix Analytics for Security with Splunk Cloud IDM and Splunk 8.1 64-bit. For more information, see Splunk integration.
Deprecated support
Removed support for Splunk 7.1 64-bit
You can no longer integrate Citrix Analytics for Security with Splunk 7.1 64-bit. For information on supported Splunk versions, see Splunk integration.
January 11, 2021
Fixed issue
-
On the Virtual Apps and Desktops site card, the label Supported client users is renamed to Received events from users. The label Unsupported client users is renamed to Unable to receive events from users.
[CAS-44773]
December 17, 2020
What’s new
Use preconfigured custom risk indicators and a policy to block access from unusual locations (geofencing)
Citrix provides a list of preconfigured custom risk indicators and a policy that help you monitor the security of your Citrix infrastructure. With these indicators and a policy, you can block the user access originating from countries that are outside their usual operating country. By default, the country is set to “United States”. You can set your required country for geofencing.
The following are the preconfigured custom risk indicators and a policy:
-
CVAD-Session started outside of geofence
-
GW-Geofence crossing
-
CCC-Geofence crossing
-
Session start outside of geofence
For more information, see Preconfigured custom risk indicators and policies.
View accessed locations in the user-response email
Instead of a user device’s IP address, the user-response email now displays all locations accessed by the user in the last 15 minutes. The location is displayed in the <City>,<Country><!--NeedCopy-->
format. If the city or country is unavailable, the corresponding value is shown as “Unknown”.
For more information, see Request user response.
Renamed Content Collaboration risk indicator- First time access from new location
The Citrix Content Collaboration risk indicator First time access from new location is renamed as Access from an unusual location.
For more information, see Access from an unusual location.
Deprecated features
Risk indicator feedback
The risk indicator feedback mechanism is removed. If the Content Collaboration risk indicator- Access from an unusual location is incorrectly triggered, you can no longer report it as a false positive and provide feedback.
December 07, 2020
What’s new
Improvements to the Potential data exfiltration risk indicator
The following enhancements are made to the risk indicator:
-
The information in the WHAT HAPPENED section is updated. The time format is updated to maintain consistency.
-
The device location information appears in the event list.
For more information about the risk indicator, see Potential data exfiltration.
Improvements to the Content Collaboration risk indicator- First time access from new location
On the user risk timeline, select First time access from new location to view the following information:
-
Sign in locations: Displays a geographical map view of the usual and unusual locations from where the user has signed in.
-
Number of sign-ins from usual locations - last 30 days: Displays a pie chart view of the top 6 usual locations from where the user has signed in the last 30 days. It also displays the number of sign-in events from these locations.
-
Event details for unusual location: Provides the list of the sign-in events from the unusual location for the user.
For more information about the risk indicator, see First time access from new location.
November 30, 2020
What’s new
Self-service search page improvements
Following improvements are made to enhance the usability of the self-service search page:
-
The search box displays an example of a query to indicate how to type your own query.

-
In macOS, the scroll bar on the dimension list now appears by default.
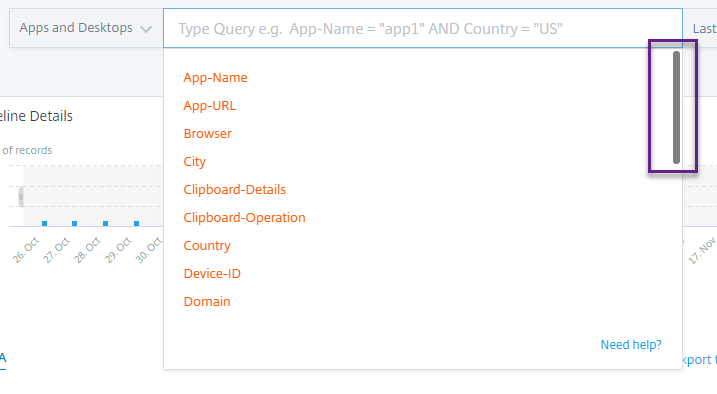
-
The applied filters now appear as chips.

-
The Add or Remove Columns label replaces the + icon.

For more information, see Self-service search.
Policy improvements
The Policies page now displays the policies associated with the data sources that are successfully discovered and connected to Citrix Analytics. This page does not display the policies that have a condition defined for the undiscovered data sources. Turning off data processing for an already connected data source does not affect the existing policies on the Policies page.
For more information, see Configure policies and actions.
November 04, 2020
What’s new
Unusual Authentication Failure - Citrix Gateway risk indicator
Citrix Analytics detects access-based threats when a user has logon failures from an unusual IP address and triggers the Unusual Authentication Failure risk indicator.
This risk indicator is triggered when a user in your organization has logon failures from an unusual IP address that is contrary to their usual behavior.
For more information, see Citrix Gateway risk indicators.
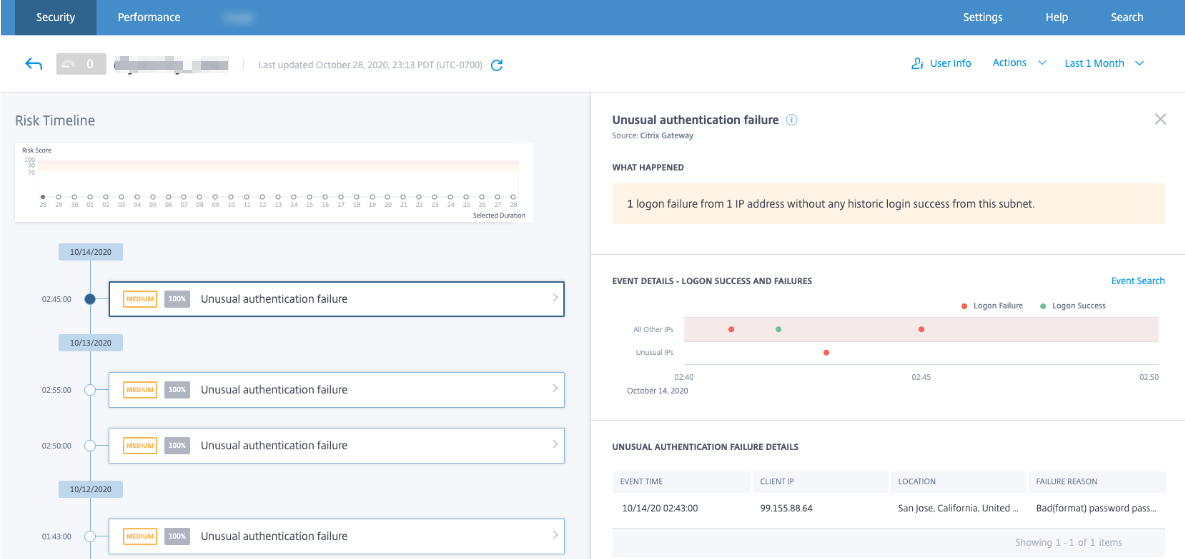
October 20, 2020
Fixed issue
-
The risk indicator First time access from new device with Log off user action applied is not working as expected.
[CAS-40743]
October 15, 2020
New features
Access from an unusual location – Citrix Virtual Apps and Desktops and Citrix DaaS risk indicator
Citrix Analytics detects access-based threats based on unusual sign-ins from Citrix Workspace and triggers the corresponding risk indicator.
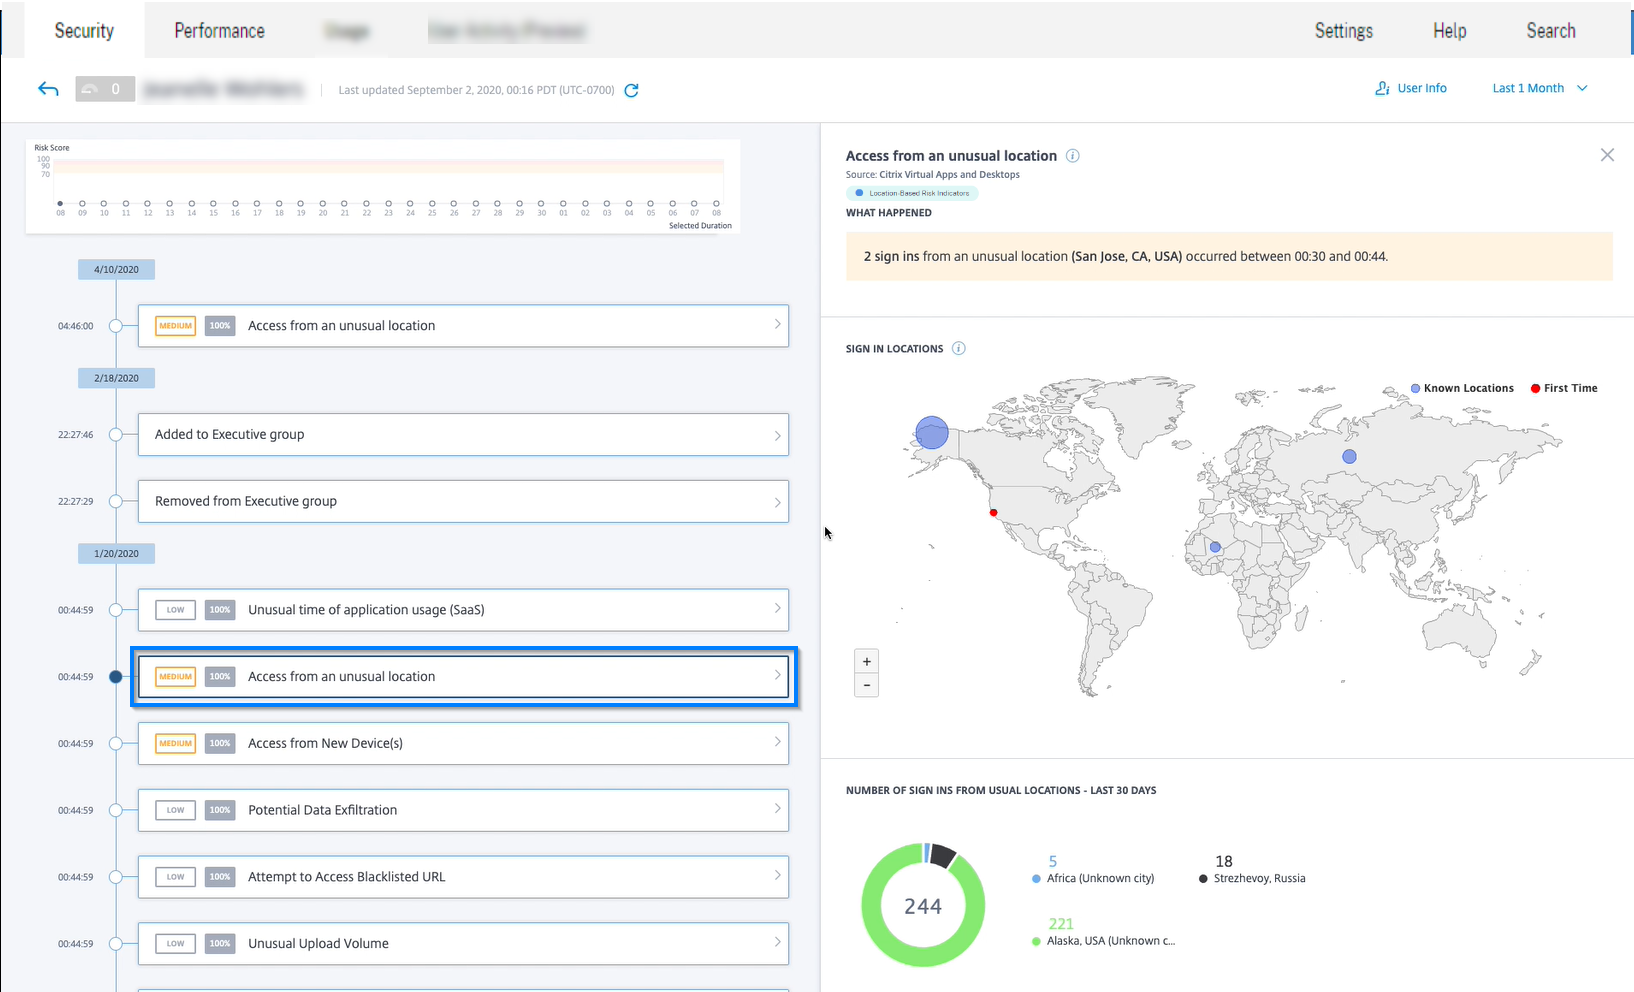
For more information, see Citrix Virtual Apps and Desktops and Citrix DaaS risk indicators.
Share Link dashboard enhancements
-
The SHARE URL column is now replaced by the SHARE ID column. Each share URL is now identified with a share ID.
-
Time selection on the dashboard is removed. Now, this dashboard displays all share links from the active state to the expired state instead of a selected period.
-
All share links are sorted in the order of active links first and then the expired links. By default, the share link with highest risk indicator count appears on the top of the list.
-
The risky links now display the active links that have risky behavior. It does not show the expired links. By default, the risky link with highest risk indicator count appears on the top of the list.
-
The trend view in the Risky Share Links card and the All Share Links card is removed.
For more information, see Share Links dashboard.
Share Link risk timeline enhancements
The risk timeline now displays the share ID instead of the share URL. For more information, see Share Link risk timeline.
Deprecated features
Access from device with unsupported operating system (OS) risk indicator deprecated
The Citrix Virtual Apps and Desktops risk indicator - Access from device with unsupported operating system (OS) has been deprecated. You can only view historic data related to this indicator.
The following changes are applicable as part of this deprecation:
-
Analytics no longer generates these risk indicators.
-
Analytics no longer generates policies with these risk indicators as the conditions.
-
Default policies with these risk indicators as the conditions no longer take effect.
For more information, see Citrix Virtual Apps and Desktops and Citrix DaaS risk indicators.
September 10, 2020
New features
Checklist for StoreFront
Citrix Analytics now displays a list of prerequisites that you must meet before downloading the StoreFront configuration file. Review the checklist and ensure that all the minimum requirements are selected. If the minimum requirements are not selected, you cannot download the configuration file. For more information, see Citrix Virtual Apps and Desktops data source.

Self-service search - support for NOT EQUAL (!=) operator
You can now use the NOT EQUAL (!=) operator in your query in the following features:
-
Custom risk indicator
-
Self-service search
You can use this operator for the following conditions:
| Data source | Dimensions |
|---|---|
| Content Collaboration | Country, City, Client OS |
| Access Control | Country, City, Action, URL, URL Category, Reputation, Browser, OS, Device |
| Apps and Desktops | Country, City, App Name, Clipboard operation, Browser, OS |
| Gateway | Authentication Stage, Client IP |
Using the operator, create a custom indicator expression with a single value such as “Country != XYZ” and view the list of users. Then create a policy to apply actions such as Add to watchlist, Notify admin, or Disable user. You can also use the operator in the self-service search of the specified data sources to filter the user events.
While entering the values for the dimensions in your query, use the exact values that are shown on the self-service search page for a data source. The dimension values are case-sensitive.
September 08, 2020
New features
User Correlation
Analytics now correlates the users discovered from various data sources. This mechanism eliminates most of the duplicate users from the discovered users list. The discovered users in Analytics now display the list of unique users along with their data sources and the risk indicators.
For example, the user “Joe Smith” can have multiple user identifiers- JosephSm, joe.smith@citrix.com, and joe.smith based on the data sources. Analytics now identifies this user with a unique identifier name. All other user identifiers are correlated and events received for Joe Smith from various data sources is linked to this unique name. For more information, see Discovered users
Fixed issue
From the Actions list, after selecting the action options and clicking Apply, an error message is displayed.
[CAS-39914]
August 11, 2020
Fixed issues
- You are not able to integrate Microsoft Graph Security with Citrix Analytics. This issue occurred because the Microsoft portal failed to redirect to Citrix Analytics.
[CAS-38021]
July 31, 2020
Fixed issues
- The Estimated Triggers option in the custom risk indicator does not predict the custom risk indicator instances for the last one day.
[CAS-38129]
July 09, 2020
New features
Virtual Apps and Desktops site card displays users with supported and unsupported clients
On the site card, you can now view the number of users who are using supported and unsupported versions of Citrix Workspace app or Citrix Receiver™ clients on their endpoints.
-
Click the user count for the supported clients to view the User page that displays all the discovered users.
-
Click the user count for the unsupported clients to download a CSV file. The file lists the users and their unsupported client versions. Analytics does not receive user events from the unsupported clients and therefore, does not add the users as discovered users. Using the CSV file, you identify the users who must upgrade their clients to a supported version so that Analytics can provide security insight into their behavior.
To view the list of supported clients, see Citrix Virtual Apps and Desktops and Citrix DaaS data source.
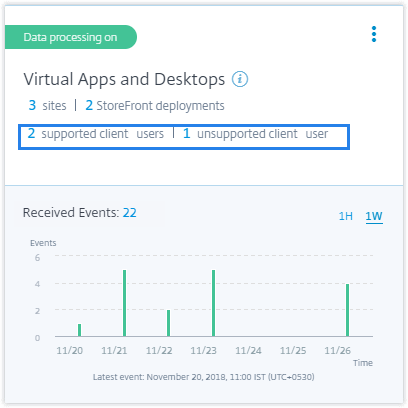
Access from an unusual location risk indicator
-
The Citrix Gateway risk indicator First time access from new location is renamed as Access from an unusual location.
-
On the user risk timeline, a geographical map and a pie chart are introduced in the event details section.
-
Sign in locations: This section displays a geographical map view of the user’s usual and unusual locations. The usual and unusual locations are indicated by a color code on the top right section of the geo map. You can zoom the geo map to get a closer look of the location.
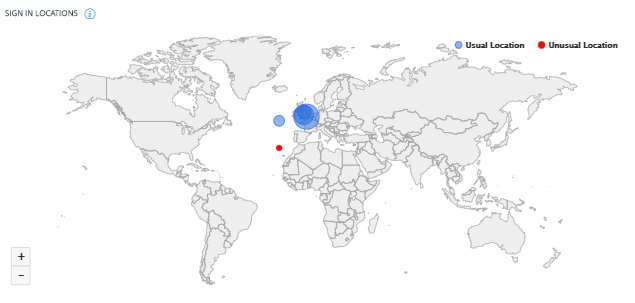
-
Usual locations - last 30 days: This section displays a pie chart that gives a view of the top 6 usual locations that the user has signed in from. Each location is marked with a different color code. You can sort the section by the location to get a detailed view of the selected location.
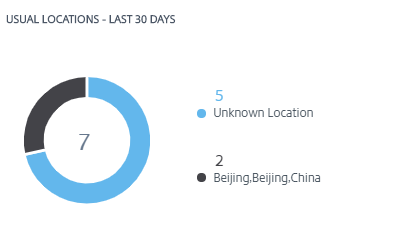
-
For more information, see Access from an unusual location.
Users dashboard data
The number of risky users, discovered users, privileged users, and users in the watchlist are displayed for the last 13 months irrespective of the time period selected on the Users dashboard and the Users page. When you select the time period, the risk indicator occurrences change.
For more information, see Users dashboard.
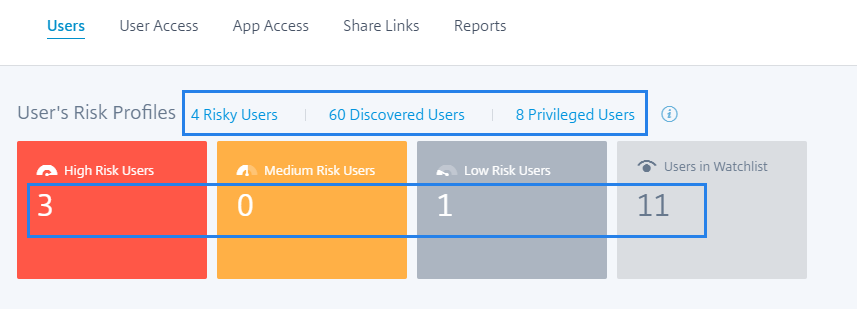
Redesigned Users page
The Users page has been enhanced for a better user experience. It provides a consolidated summary of the user events based on the user risk scores, data source, and user type.
To support a more focused search, the Users page contains the Filters section on the left pane and the search bar on top. You can search for user events for a preset time or a customized time range.
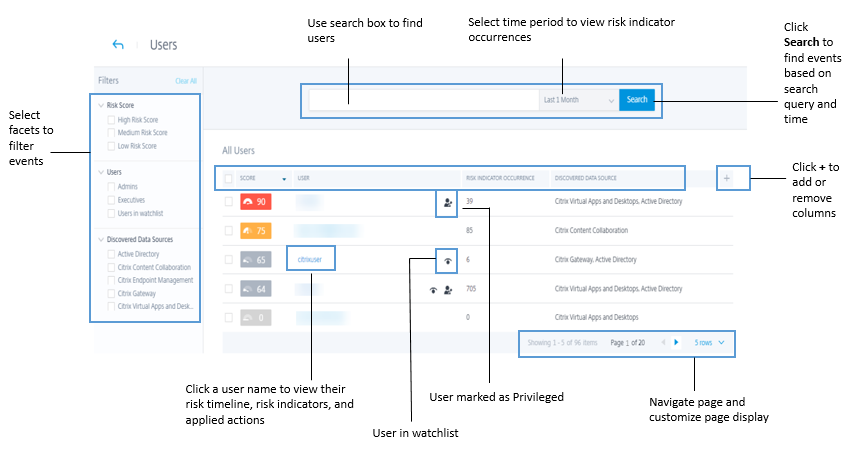
To view the Users page:
-
Go to Security > Users to view the Users dashboard and do the following:
-
Click one of the following links or the cards.

-
On the Risky Users pane, click See More.
-
On the Users in Watchlist pane, click See More.
-
On the Privileged Users pane, click See More.
-
-
Go to Settings > Data Sources > Security. Click the number of users on any data source site card.
For more information, see Users dashboard.
Risky Users pane enhancements
The Change column is replaced with the Risk Indicators column. The Risk Indicators column displays the total risk indicator occurrences of a user for a specific time period.
For more information, see Risky Users.
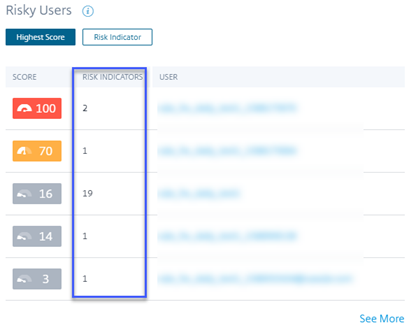
Users in Watchlist pane enhancements
The Change column is replaced with the Risk Indicators column. The Risk Indicators column displays the total risk indicator occurrences of a user for a specific time period.
For more information, see Users in watchlist.
Privileged Users pane enhancements
-
The Change column is replaced with the Risk Indicators column. The Risk Indicators column displays the total risk indicator occurrences of a user for a specific time period.
-
Click See More to view the Users page. The Users page that displays the list of admin and executive privileged users. On this page, you can add or remove a user as a privileged user.
For more information, see Privileged users.
Deprecated features
Alerts
The Alerts feature is now deprecated and no longer available on the Analytics user interface.
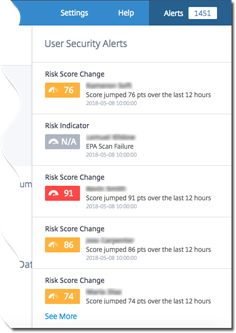
Risky Users and Watchlist page
The Risky Users and Watchlist pages are deprecated. They are replaced with the Users page that summarizes all the risky user events and the users in the watchlist.
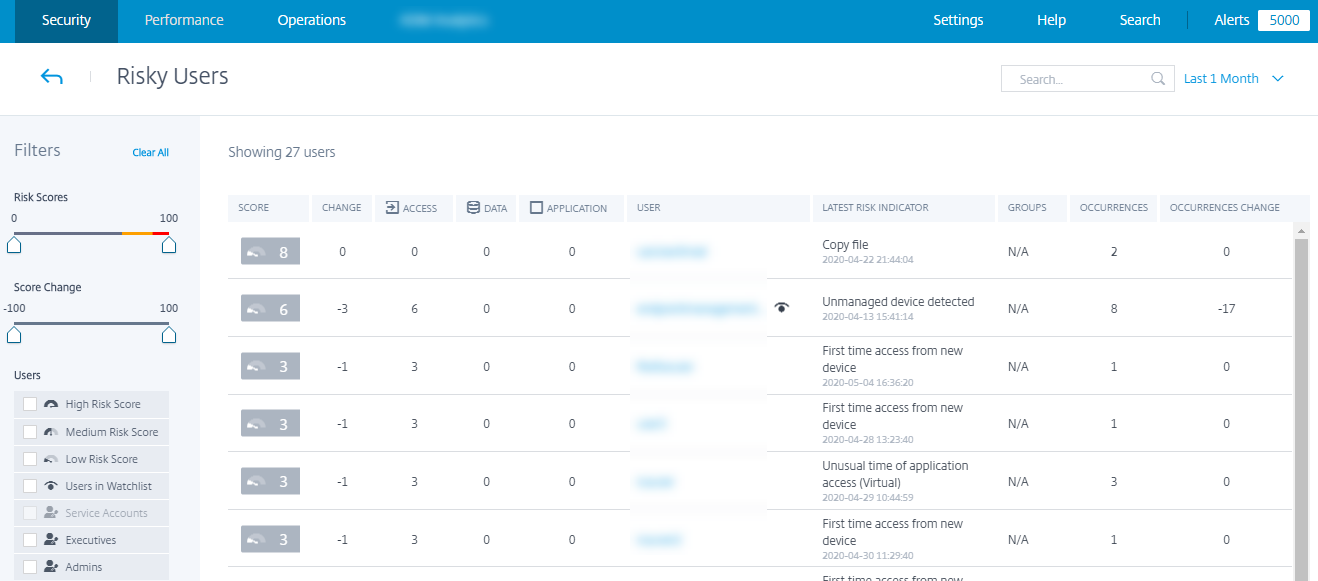
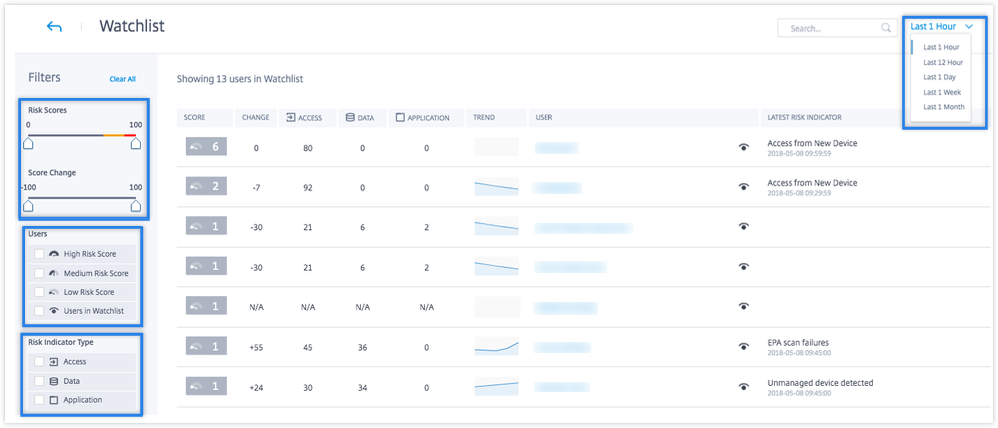
Risky Users pane
The Highest Score Change and Risk Indicator Change tabs are removed from the Risky Users pane.
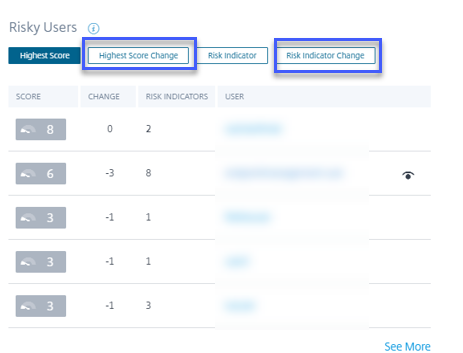
Risk Indicator pane
-
The Occurrence Change tab and the CHANGE column are removed.
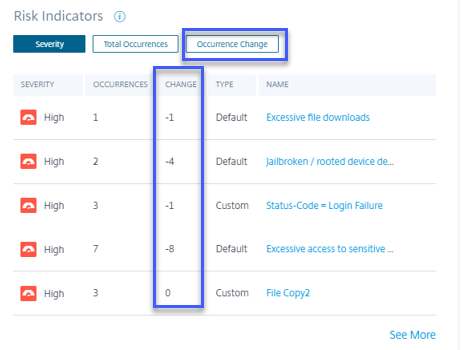
-
The Risk Indicator Details page is deprecated. Previously, this page was displayed when a risk indicator was selected on the Risk Indicators pane or on the Risk Indicator Overview page.
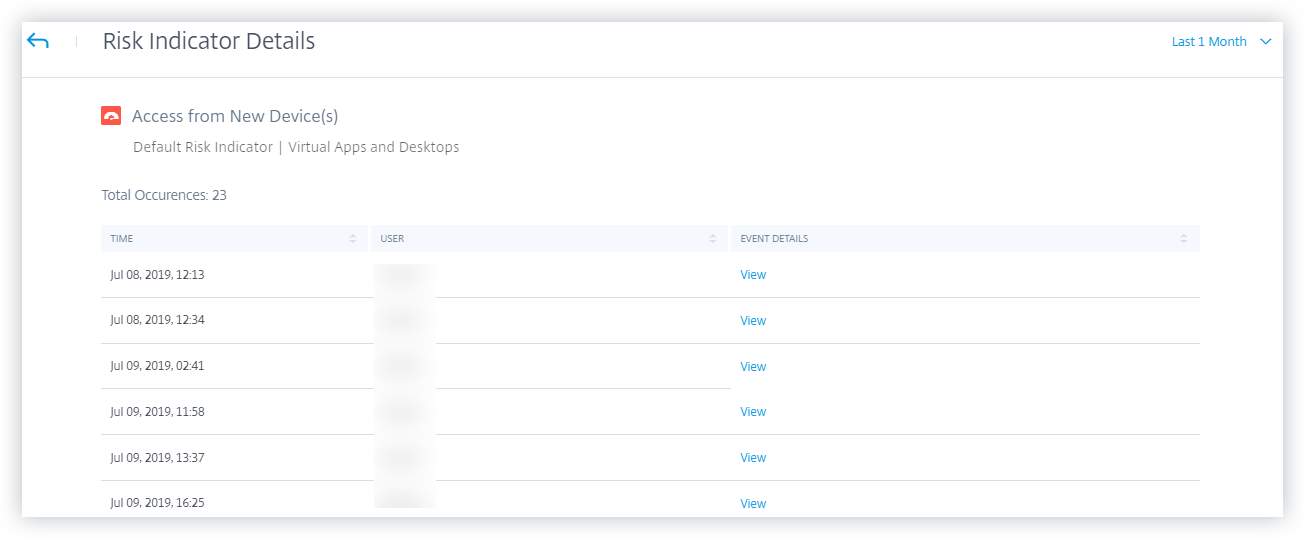
Trend view
On the Users dashboard, the trend view of user count is removed from the High Risk Users, Medium Risk Users, Low Risk Users, and Users in Watchlist cards.

User Groups page
The User Groups page under the Settings option is deprecated. You can no longer add or remove a user group as a privileged group. However, you can add or remove individual users as privileged users. For more details, see Privileged users.
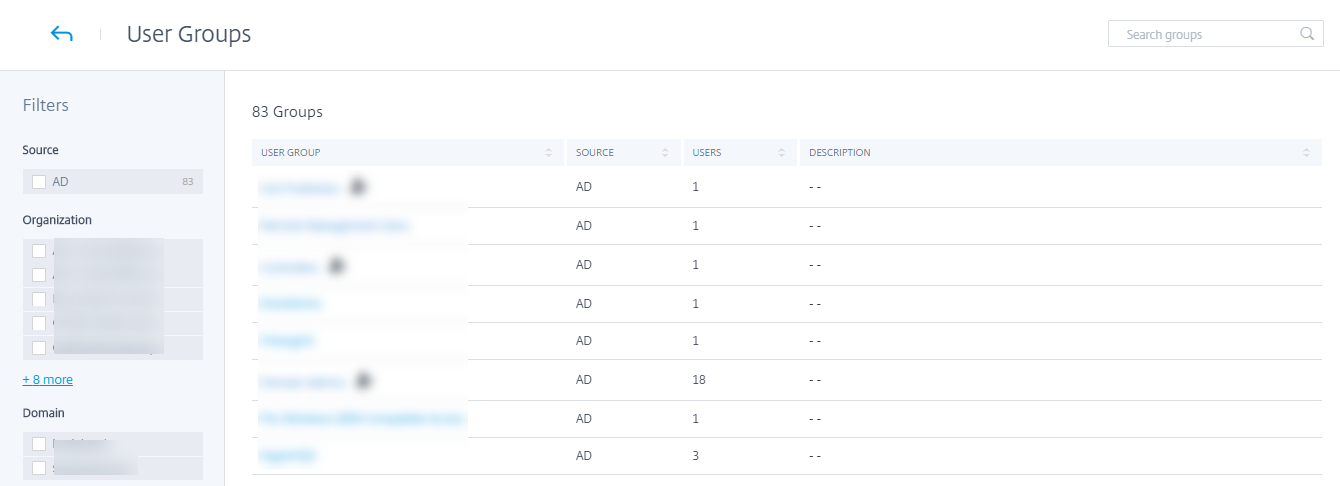
June 26, 2020
Deprecated features
Unusual time of application access (Virtual/SaaS) risk indicators deprecated
The Citrix Virtual Apps and Desktops risk indicators - Unusual time of application access (Virtual) and Unusual time of application access (SaaS) have been deprecated. You can only view historic data related to these indicators.
The following changes are applicable as part of this deprecation:
- Analytics no longer generates these risk indicators.
- Analytics no longer generates policies with these risk indicators as the conditions.
- Default policies with these risk indicators as the conditions no longer take effect.
For more information, see Citrix Virtual Apps and Desktops and Citrix DaaS risk indicators.
June 02, 2020
Fixed issues
-
On the user risk timeline, the status of the Virtual Apps and Desktops actions (policy-based or manually applied) appears as “Failure” even though the actions are successfully applied on the user account. For example, the Start session recording action is successfully applied on the user account, but the result is shown as “Failure”. [CAS-32773]
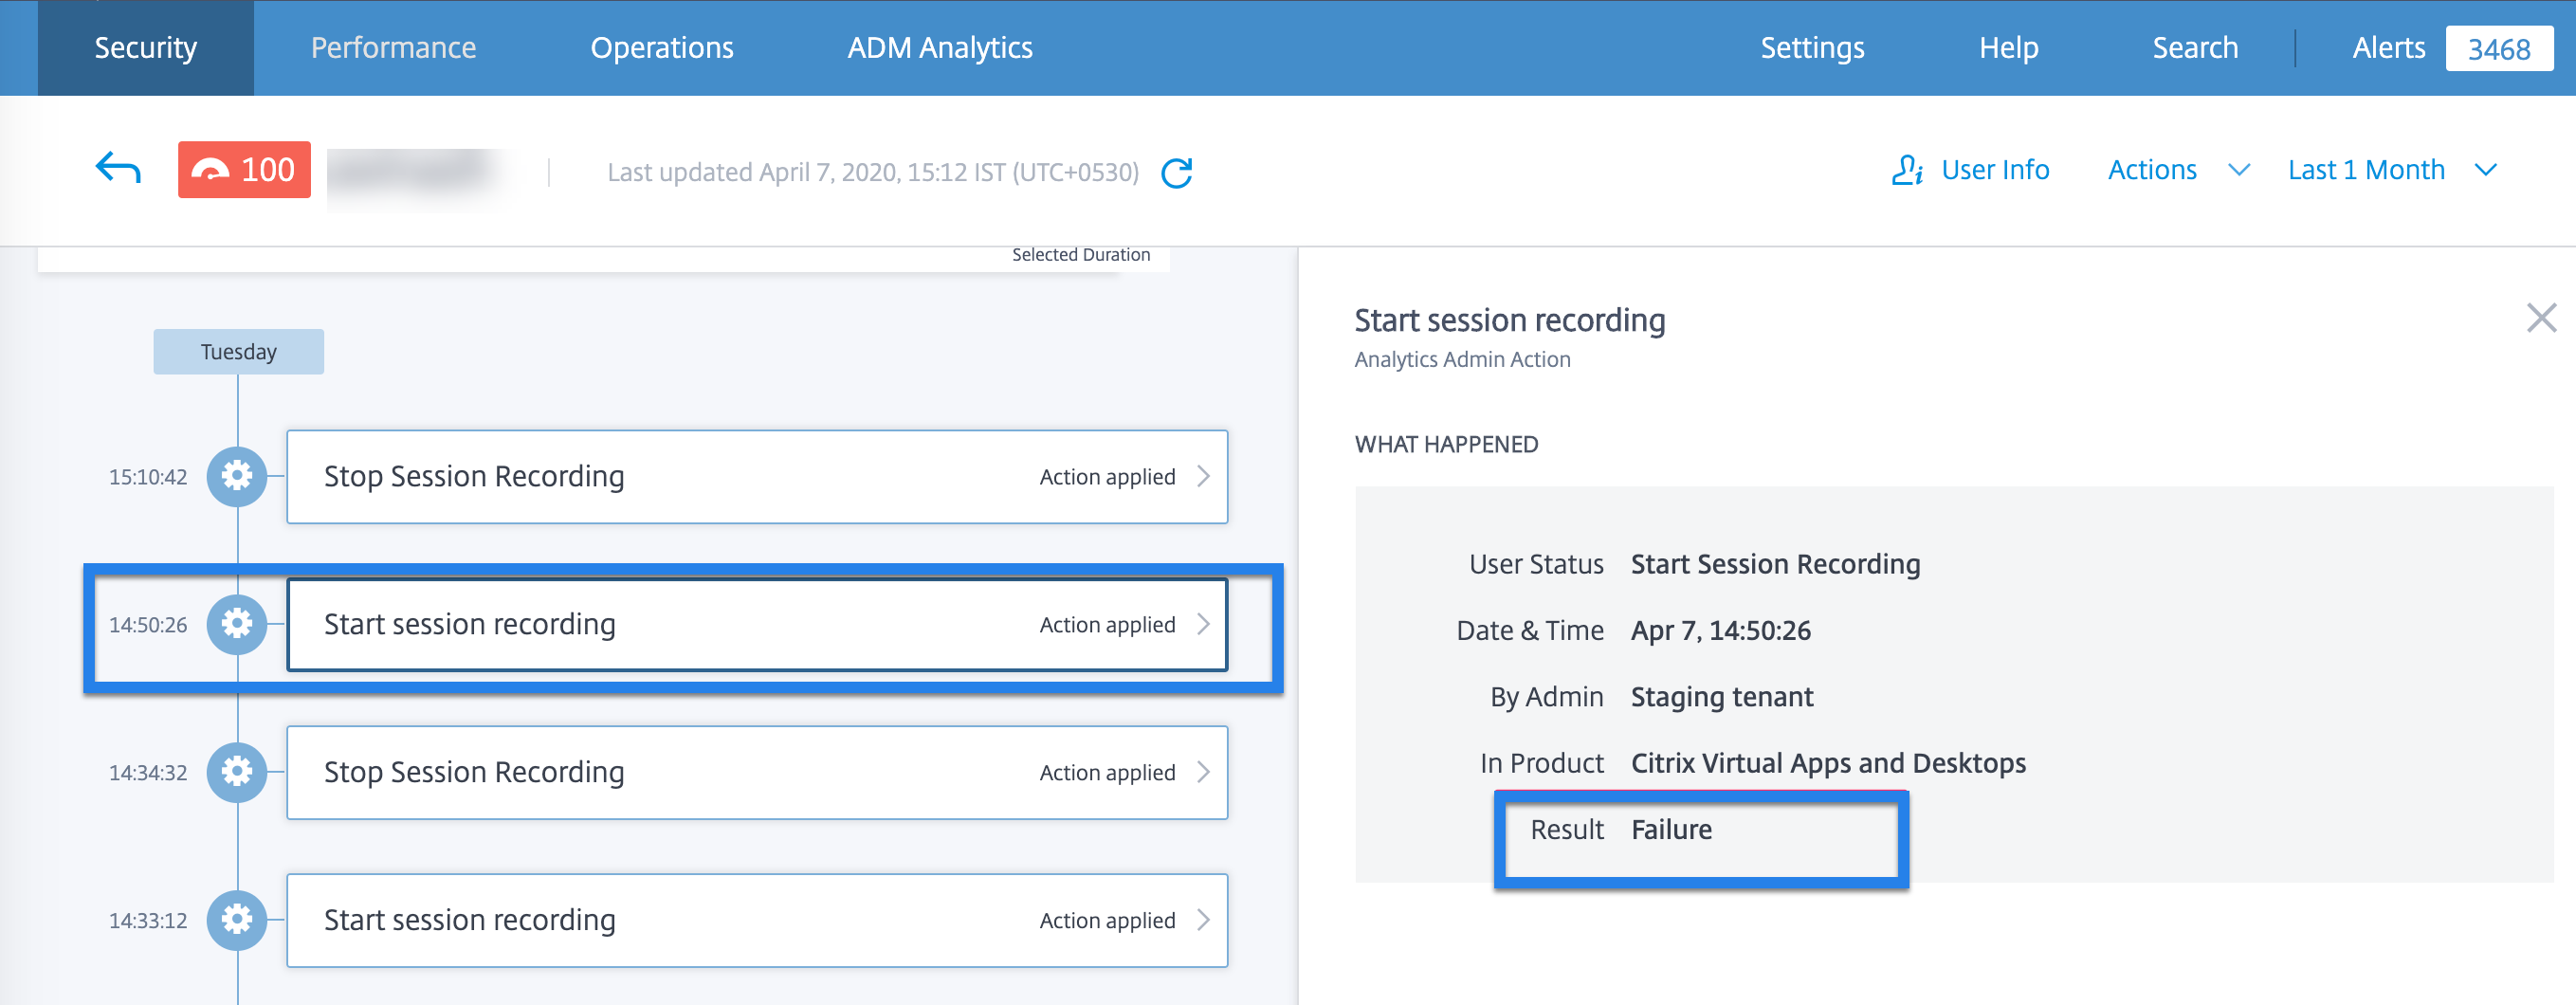
May 11, 2020
Fixed issues
-
For some users, the policy-based actions are not triggered and the policy enforcement mode cannot be applied. This issue occurs when the customer IDs are not in lower case.
[CAS-34209], [CAS-34141]
-
Unable to create custom risk indicators for some users. This issue occurs when the customer IDs are not in lower case.
[CAS-34139]
April 29, 2020
Fixed issues
-
Actions applied on Citrix Virtual Apps and Desktops risk indicators fail to take effect although Analytics displays a message that the actions are successfully applied. This issue is observed in the Citrix Virtual Apps and Desktops 7 1912 version.
[CAS-31544]
April 02, 2020
New features
Disable data processing when StoreFront is not added
On the Settings > Data Sources > Security > Virtual Apps and Desktops data source site card, the Turn on Data Processing button does not get enabled if you have not onboarded StoreFront. You see the StoreFront not connected warning message on the site card. If you have an active on-premises site from where you want Analytics to receive data, you must verify that you have onboarded StoreFront to Citrix Analytics. It ensures that your user accounts are protected.
On the Virtual Apps and Desktops site card, select the vertical ellipsis (⋮) and click Connect StoreFront deployment. On the screen that is displayed, follow the instructions and complete the StoreFront configuration.
For more information, see Onboard Citrix Virtual Apps and Desktops on-premises sites using StoreFront.
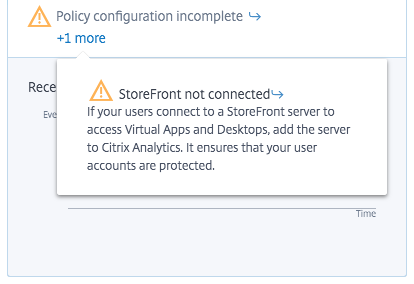
Fixed issues
-
For Citrix Content Collaboration users, policy-based actions fail to take effect under the following conditions:
-
When custom risk indicator conditions are defined
-
Until a risk indicator is generated for a user
[CAS-29226]
-
March 04, 2020
Fixed issues
- When Gateway users onboard to Analytics for the first time, they see the error Citrix ADC is unresponsive or credentials are incorrect. Upon retrying, they see the error Device with this IP address already exists.
[CAS-31180]
February 20, 2020
New features
Citrix Analytics for Security offering
Citrix Analytics for Security is now available for individual subscription. You can subscribe to Citrix Analytics for Security and get insights that are specific to this offering. For more information, see Get started.
Risk Categories dashboard
Citrix Analytics introduces categorization of risk indicators based on risks that have a similar impact on the organization’s security aspect. This dashboard provides a comprehensive view of the risk exposures and critical risks that require immediate attention. For default risk indicators, Analytics automatically assigns a risk category based on the risk exposure. For custom risk indicators, you must select an appropriate risk category based on the risk exposure.
Analytics supports the following risk categories:
- Data exfiltration
- Insider threats
- Compromised users
- Compromised endpoints
For more information, see Risk Categories.
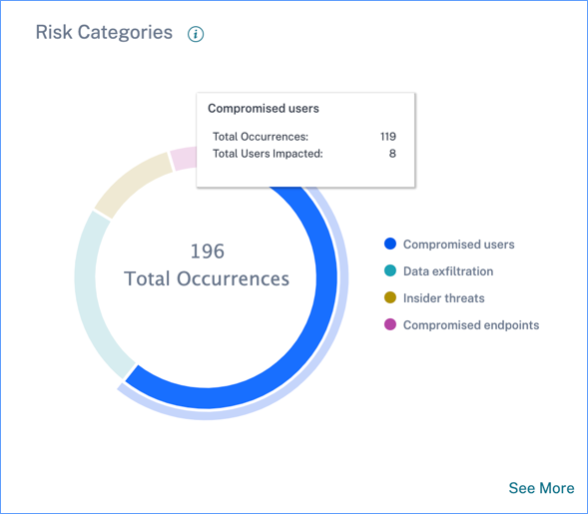
Risk Category column on the Custom Indicators page
The Risk Category column is introduced on the Custom Risk Indicator page. Based on type of risk exposure, you can select a risk category for your custom risk indicator. Previously created custom risk indicators are displayed on the Risk Categories dashboard if you modify them by selecting a risk category.
For more information, see Custom risk indicators.
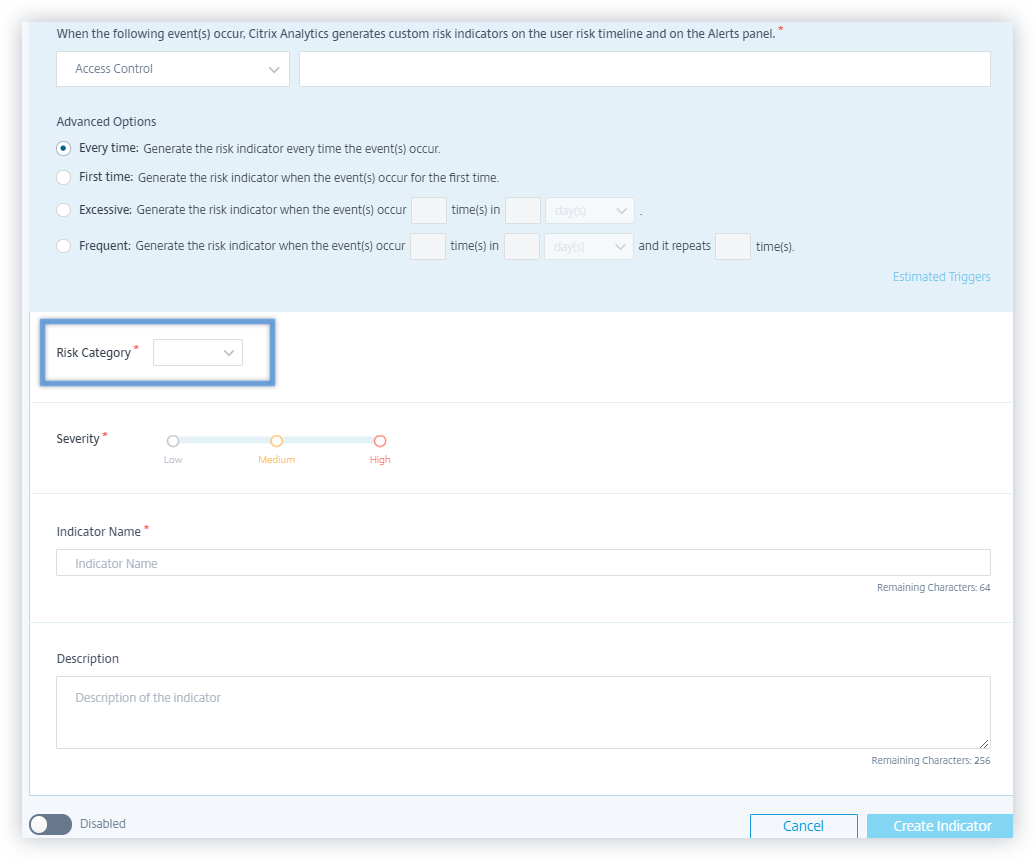
Change in risk indicator names
The following risk indicator names have been changed:
| Data Source | Old Name | New Name |
|---|---|---|
| Citrix Virtual Apps and Desktops and Citrix DaaS | Unusual application usage (Virtual) | Unusual time of application access (Virtual) |
| Citrix Virtual Apps and Desktops and Citrix DaaS | Unusual application usage (SaaS) | Unusual time of application access (SaaS) |
| Citrix Content Collaboration | Excessive logon failures | Excessive authentication failures |
| Citrix Content Collaboration | Unusual logon access | First time access from new location |
| Citrix Access Control | Unusual download volume | Excessive data download |
| Citrix Gateway | Logon failures | Excessive authentication failures |
| Citrix Gateway | Authorization failures | Excessive authorization failures |
| Citrix Gateway | Unusual logon access | First time access from new location |
For more information, see Risk indicators.
Fixed issues
-
For some users, Citrix Analytics is unable to receive any data from Virtual Apps and Desktops even though the data source is successfully onboarded and StoreFront is enabled. [CAS-24134]
-
Citrix Analytics is unable to receive download events from Citrix Content Collaboration. Therefore, the following risk indicators are not triggered:
-
Anonymous sensitive share download
-
Excessive share link downloads
-
Excessive access to sensitive files
-
Excessive file downloads
[CAS-29207]
-
-
For newly onboarded users, manual and policy-based actions applied on Citrix Gateway risk indicators do not take any effect. [CAS-29029]
-
Some users are unable to view the site cards on the Data Sources page. This issue is resolved by repopulating the cache. [CAS-28781]
January 09, 2020
New features
Continuous risk assessment
Some challenges Citrix Workspace users face are that, remote access exposes sensitive data to security risks through cyber-criminal activities like data exfiltration, theft, vandalism, and service disruptions. Employees within organizations are also likely to contribute to this damage.
Some ways of addressing these risks are to implement multifactor authentication, enforce short sign-in timeouts, and so on. Although these risk assessment methods ensure a higher level of security, they do not provide complete security after the initial validation.
To enhance the security aspect and to ensure a better user experience, Citrix Analytics introduces the solution of continuous risk assessment. This solution helps you to continuously monitor user profiles and take various actions when risky events are detected.
For more, information, see Continuous risk assessment.
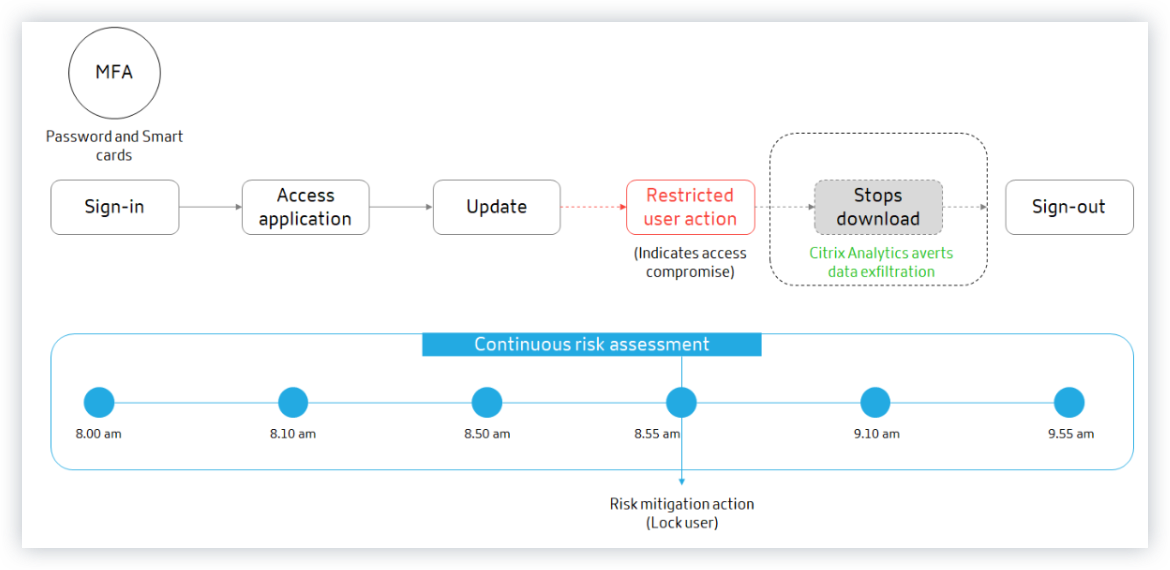
Policy configuration
Citrix Analytics helps you to manage policy configurations more efficiently. You can protect user accounts from malicious attacks with the help of the following capabilities:
-
Default policies: Citrix Analytics supports the following default policies:
- Successful credential exploit
- Potential data exfiltration
- Unusual access from a suspicious IP
- Unusual app access from an unusual location
- Low risk user - first time access from new IP
- First time access from device
You can modify the default policies based on your requirements.

-
Multiple conditions: A policy can contain up to four conditions. The conditions can be set with combinations of risk scores and risk indicators, or both.
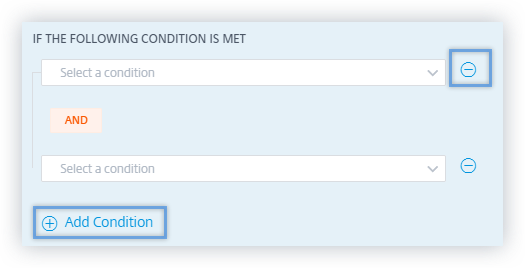
-
Default and custom risk indicators: The conditions menu on the Create Policy page is now segregated based on default and custom risk indicators. When creating a policy, you can switch between the default and custom risk indicators tabs, and set the risk indicator conditions.
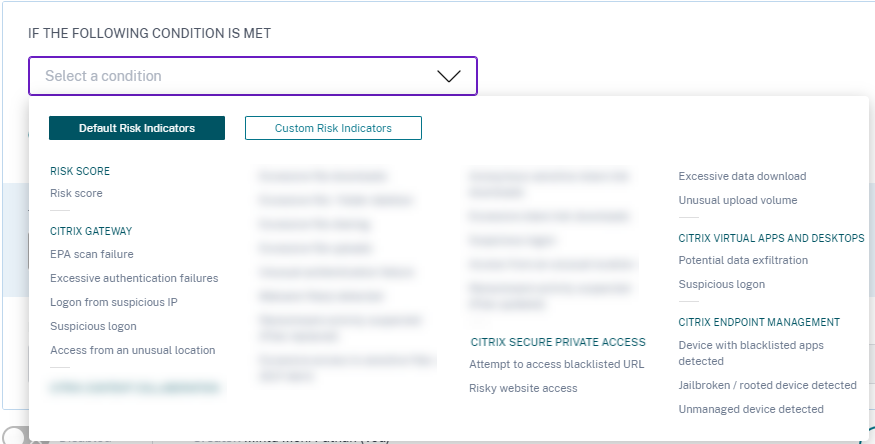
-
Request end user response: Citrix Analytics introduces the Request end user response action. Using this action, you can send an email notification to the user regarding the risky activity detected. Once the user responds about the activity, you can determine the next course of action to be taken on their account. You can also set the user response time. If no response is received, Citrix Analytics considers No response as the status.
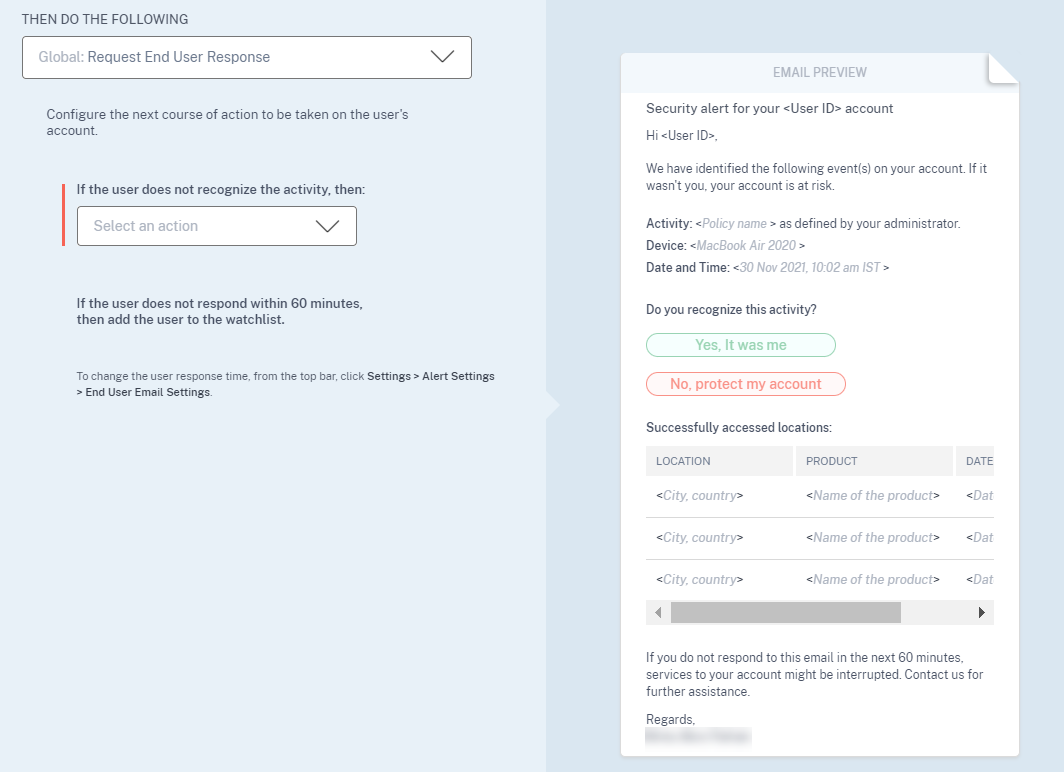
-
Apply disruptive actions: You can notify the users when a disruptive action such as Log off user or Lock user, is applied. A notification is sent to the user with details of the activity and the action applied. This action temporarily disrupts services to the user’s account to prevent further misuse. To continue accessing the account, the user must contact the administrator for assistance.
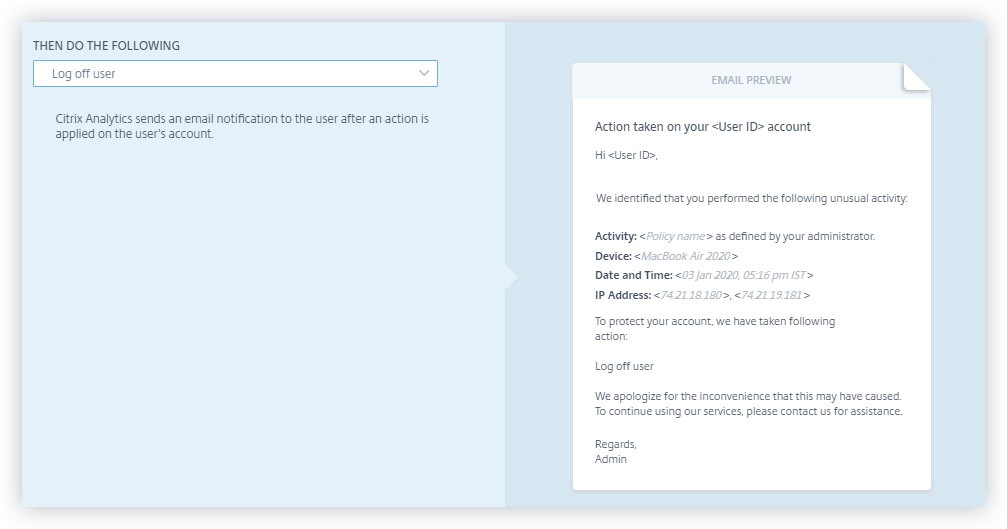
-
Enforcement and monitor modes: You can set enforcement or monitor modes to your policies.
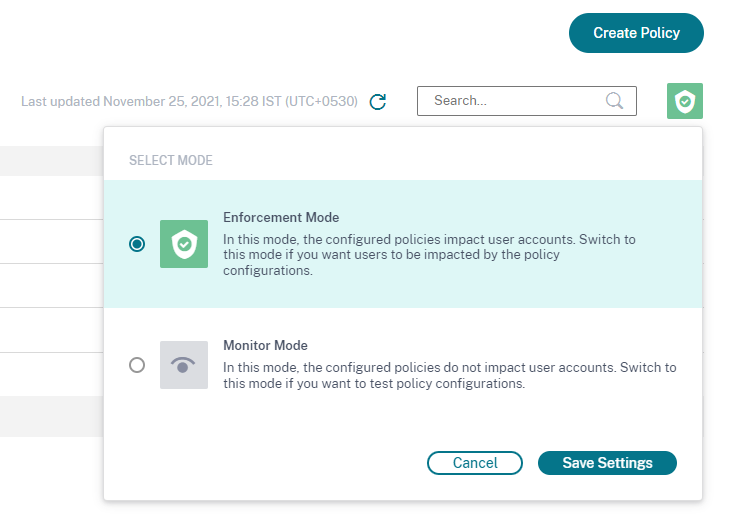
For more information on policy enhancements, see Policies and actions.
Lock user and Unlock user actions
Citrix Analytics introduces the following Gateway actions:
- Lock user
- Unlock user
You can apply these actions either manually or when you configure policies.
For more information, see What are actions.
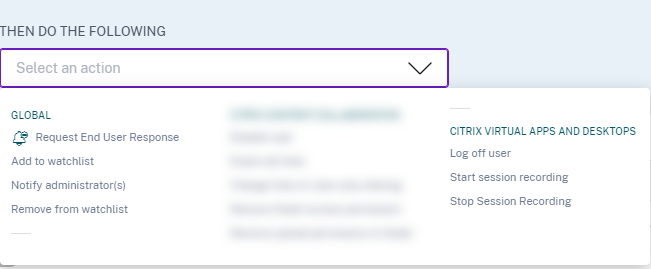
Access summary dashboard
Citrix Analytics introduces the Access Summary panel on the Users dashboard. It summarizes the total number of attempts that users have made to access the resources within an organization.
For more information, see Access summary.
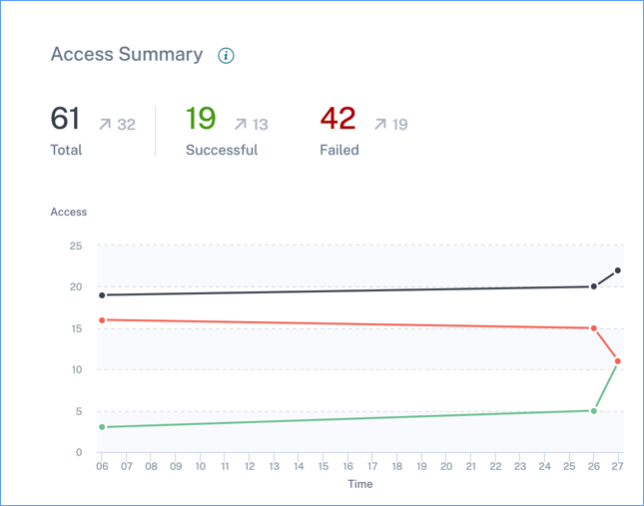
Policies and actions dashboard
Citrix Analytics introduces the Policies and Actions panel on the Users dashboard. It displays the top five policies and actions applied on user profiles. You can sort data based on the top policies and the top actions for a selected time period.
For more information, see Policies and actions.
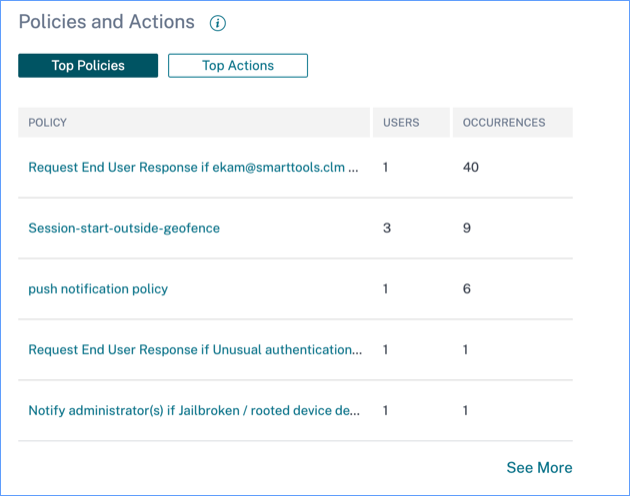
Self-service search for policies
Use the self-service search to view the user events that met your defined policies. You can also view the actions that Analytics has applied for these anomalous events. Use the facets and the search box to search for the required events.
To view the events, in the search box, select Policies from the list, select the time period, and then click Search.
For more information, see Self-service search for Policies.
Deprecated features
Risk score change policy-based condition removed
When you configure policies, you cannot use the Risk score change policy-based condition anymore. Citrix Analytics does not support this condition.
For more information, see Policies and actions.
Multiple policy-based actions removed
When you configure policies, you cannot apply multiple actions anymore. Citrix Analytics supports only one action for each policy.
For more information, see Policies and actions.
Fixed issues
- Delegated read-only administrators encounter an error while accessing the User Access and App Access dashboards. [CAS-16297]
December 12, 2019
New features
Splunk version support
Citrix Analytics supports the following versions of Splunk:
- Splunk 8.0 64-bit
- Splunk 7.3 64-bit
To get the maximum security benefits of Splunk integration, upgrade to the latest version of the Splunk add-on app from the Download page.
For more information on supported Splunk versions, see Supported versions.
December 04, 2019
New features
Custom risk indicator for Citrix Gateway
Using custom risk indicators, you can now define the conditions and the frequency for triggering risk indicators for Citrix Gateway events. When a user event meets the conditions, Analytics triggers the risk indicators. For more information on how to create custom risk indicator, see Custom risk indicators.
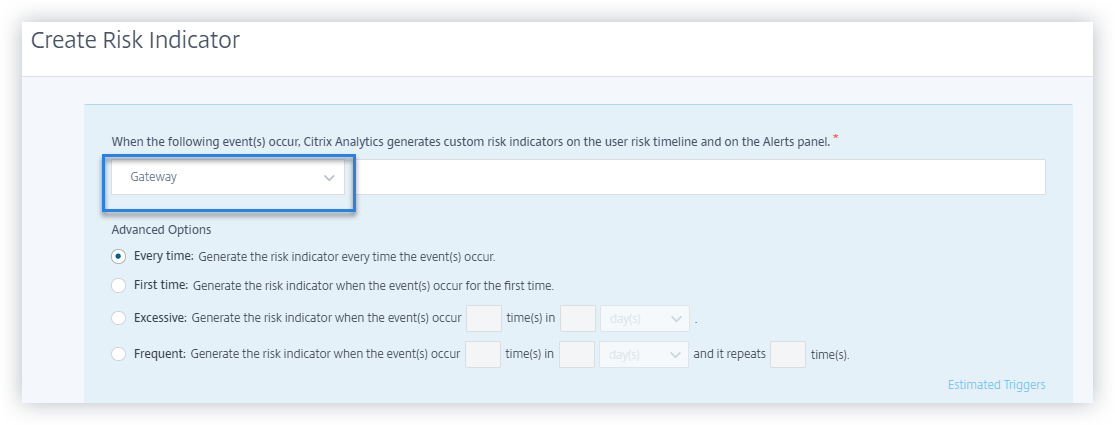
November 22, 2019
New features
First time access from new device – Citrix Virtual Apps and Desktops risk indicator
Citrix Analytics detects access threats based on access from a new device and triggers the corresponding risk indicator.
The First time access from new device risk indicator is triggered when a user signs in from a device after 90 days. This event is triggered because Citrix Receiver has no sign-in records from this new or unfamiliar device for the last 90 days. For more information, see Citrix Virtual Apps and Desktops and Citrix DaaS risk indicators.
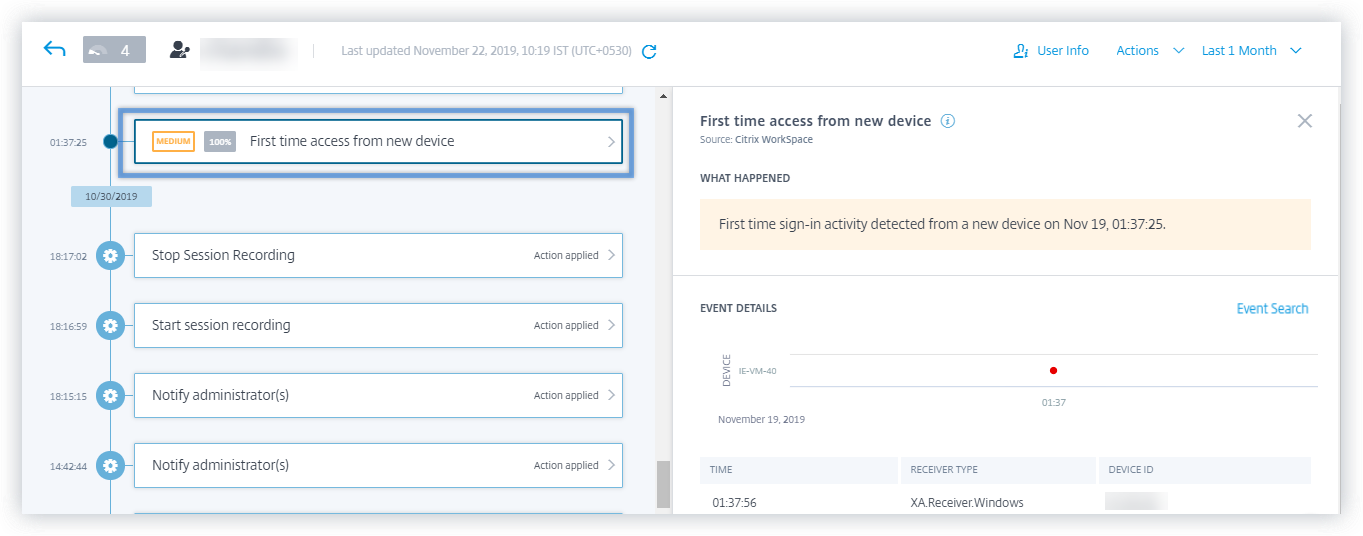
First time access from new IP - Citrix Gateway risk indicator
Citrix Analytics detects access threats based on access from a new IP address and triggers the corresponding risk indicator.
The First time access from new IP risk indicator is triggered when a user signs in from an IP address after 90 days. This event is triggered because Citrix Receiver has no sign-in records from the new or unfamiliar IP address for the last 90 days.
For more information, see Citrix Gateway risk indicators.
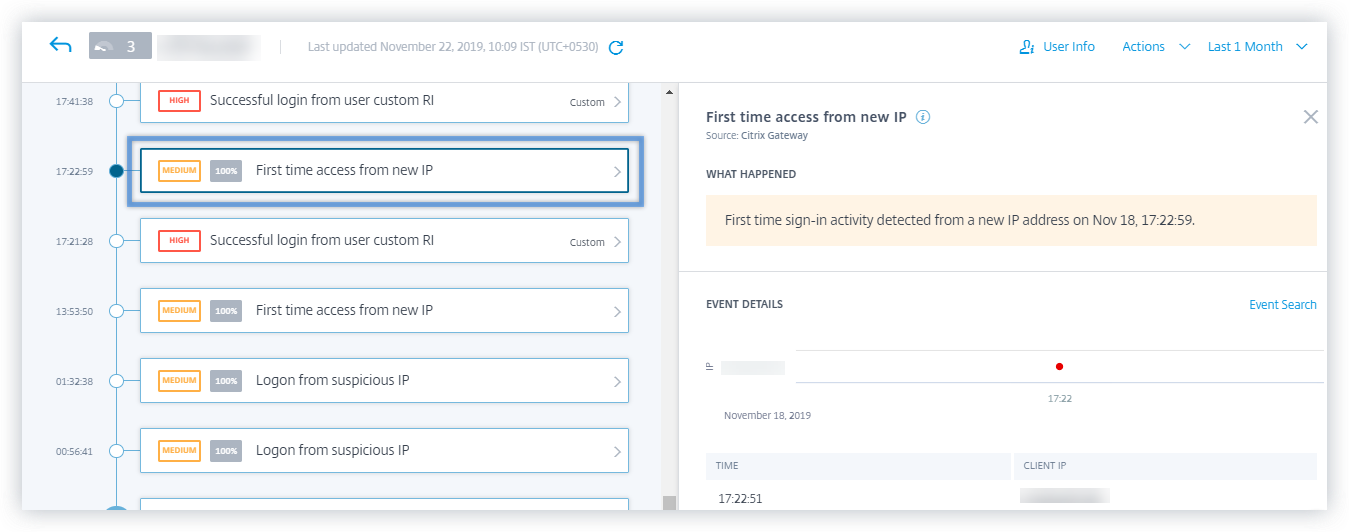
Logon from suspicious IP - Citrix Gateway risk indicator
Citrix Analytics detects user access threats based on the suspicious IP sign-in activity and triggers the Logon from suspicious IP risk indicator.
This risk indicator is triggered when a user attempts to access the network from a suspicious IP address. Analytics considers an IP address as suspicious based on any of the following conditions:
-
Is listed on the external IP threat intelligence feed
-
Has multiple user sign-in records from an unusual location
-
Has excessive failed sign-in attempts that might indicate a brute-force attack
For more information, see Citrix Gateway risk indicators.
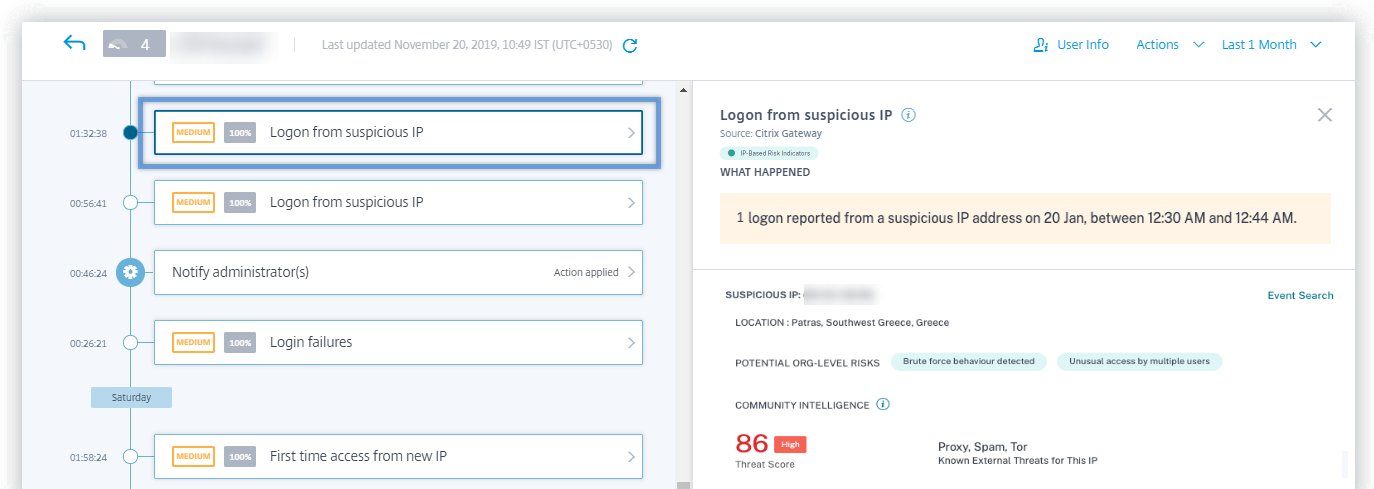
Self-service search for Citrix Gateway events
Use the self-service search feature to get insight into user events received from the Citrix Gateway data source. Citrix Analytics receives events such as authentication stage, authorization type, VPN session code, VPN session state for Citrix Gateway users. Use the facets and the search box to search for the required events and explore the underlying data.
To view the events, in the search box, select Gateway from the list, select the time period, and then click Search.
For more information, see Self-service search for Gateway.
Self-service search for Citrix Remote Browser Isolation™ events
Use the self-service search feature to get insight into the browsing events received from the Citrix Remote Browser Isolation Service. Citrix Analytics receives events such as session connect, session launch, published applications, deleted applications for each user connection. Use the search box to search for the required events and explore the underlying data.
To view the events, in the search box, select Remote Browser Isolation from the list, select the time period, and then click Search.
For more information, see Self-service search for Remote Browser Isolation.
Remove from watch list action
You can remove a user from the watchlist either by applying the manual method or by applying a policy-based method. For more information, see Watchlist.
Improved onboarding messages when configuring a StoreFront deployment
Citrix Analytics now provides the following messages to help you configure your StoreFront deployments:
-
After downloading the configuration file, you can see a message indicating the date and time of the download and the user name. When you refresh this page, the Download file button changes to Download file again.
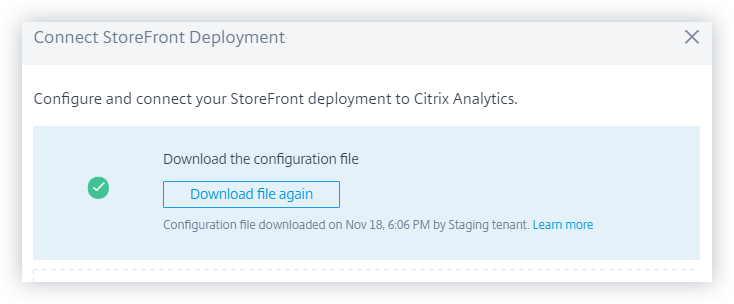
-
If your StoreFront configuration is incomplete, you see a warning message instructing you to follow configuration steps and connect your StoreFront deployment with Analytics.

For more information on how to configure your StoreFront deployment, see Onboard Citrix Virtual Apps and Desktops on-premises sites using StoreFront.
Deprecated features
Risk indicator - Access from new device remove
Citrix Analytics no longer triggers the Access from new device risk indicator. However, on the user dashboard, user timeline, and the policy dashboard, you can view historic data related to this risk indicator.
For previously created policies based on Access from new device, you must either modify the policy or create a policy with the new risk indicator First time access from new device.
Fixed issues
- The self-service search for authentication fails to display the events. [CAS-24959]
November 08, 2019
Fixed issues
-
For Citrix Content Collaboration risk indicators, users are unable to apply actions on the risk timeline. [CAS-24844]
-
Citrix Workspace app for Chrome prior to version 1911 fail to send event details to Citrix Analytics. [CAS-24938]
October 21, 2019
New features
Modified name for analytics agent
The agent name is now mentioned as Analytics policy agent on the user interfaces to indicate its role. When onboarding the on-premises Citrix Virtual Apps and Desktops data sources, Citrix Analytics clearly notifies that a policy agent is required only to configure policies and actions for your Site. This agent has no role in transmitting data from the data source. For more information, see Citrix Virtual Apps and Desktops and Citrix DaaS data source.
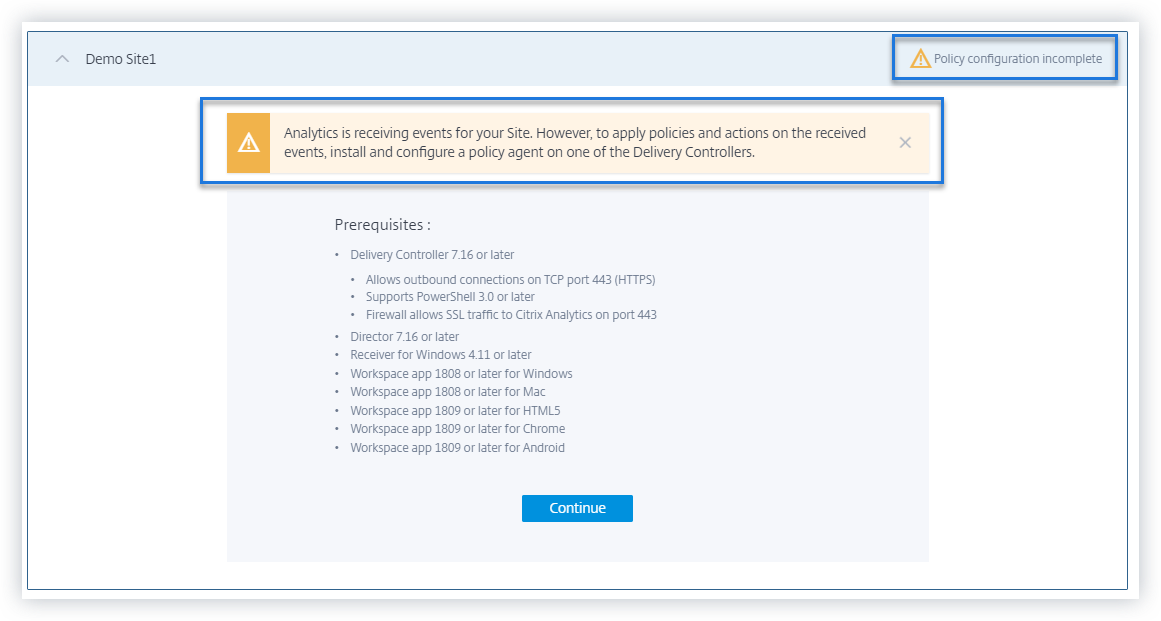
Support for the time dimension for custom report
You can now group the events based on time by selecting the Time dimension for the x-axis. The report displays the total events received based on the time intervals for the selected period. For more information on how to create reports, see Custom reports.
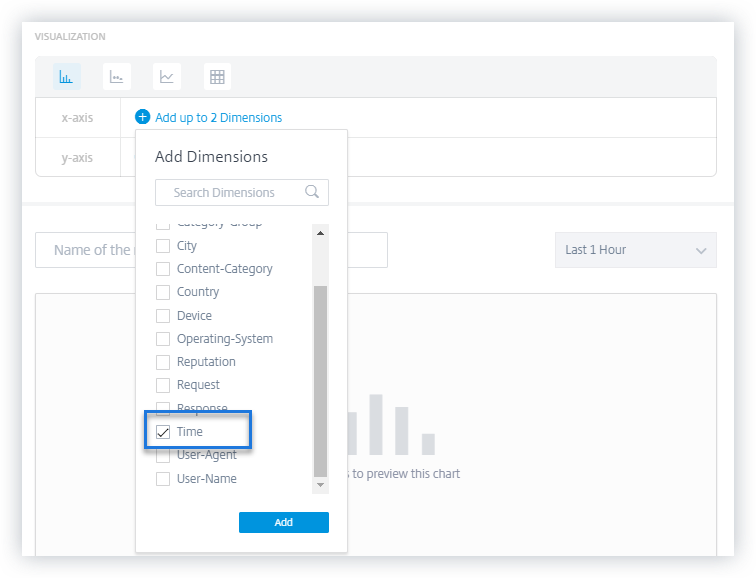
Audit logs enhancements
The user experience of the Audit Log page is enhanced.
-
You can view the date and time details when the Audit Log page was last updated and refresh the page to view the latest audit logs.
-
You can clear all the filters that were applied on the audit logs.
For more information on the audit data, see Audit logs.

Fixed issues
-
Citrix Analytics is unable to generate the Anonymous IP address risk indicator even though Microsoft Graph Security is successfully onboarded. [CAS-21329]
-
Citrix Workspace app for HTML5 prior to version 1910 fail to send event details to Citrix Analytics. [CAS-24938]
September 23, 2019
Fixed issues
- On the data sources site cards, the Latest event field displays incorrect date and time information. [CAS-24087]
August 30, 2019
New features
Change in default time period across dashboards
The default time period on the following dashboards is changed from Last 1 Hour to Last 1 Month:
-
Users
-
Risk Timeline
-
User Access
-
App Access
-
Share Links
-
Alerts History
Now the dashboards display the events for the last one month by default. You get a more engaging experience while using these dashboards. For example, when you open the App Access dashboard, the dashboard displays the app access events for the last one month by default.
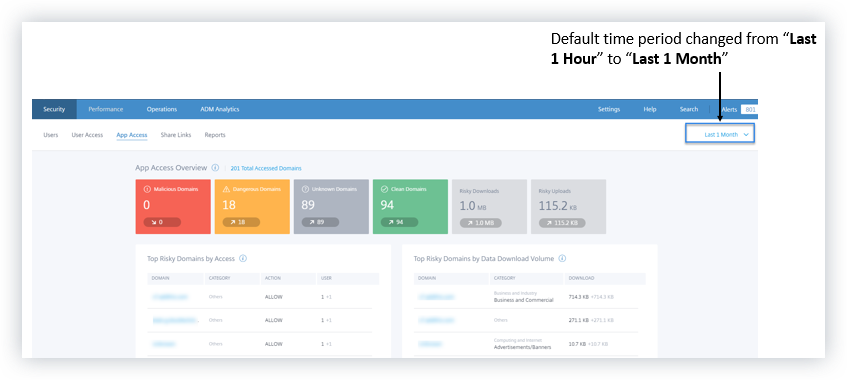
Fixed issues
-
For Content Collaboration risk indicators, the Disable user policy-based action cannot be applied successfully. [CAS-17304]
-
Citrix Analytics cannot process events from Citrix Gateway 13.0. This issue occurs because Citrix Gateway 13.0 fails to provide user names in the logon events sent to Citrix Analytics. [CAS-21339]
August 20, 2019
New features
Self-service search enhancements
-
The user experience of the self-service page is enhanced. You can now seamlessly switch back and forth between the user risk timeline and the self-service search page.
-
You can now sort your events by time. By default, the latest events appear first in the event table. Click the sort icon on the TIME column to sort the events based on either latest time or earliest time.
For more information on how to use self-service search, see Self-service search.
Custom report enhancements
-
New dimensions are added for the Access Control, Content Collaboration, and Apps and Desktops data sources. You can choose these dimensions to create reports. The following dimensions are added for the data sources:
-
Access Control: User Agent, User Name
-
Content Collaboration: User Email, User Name, Created by, Account Id, OAuth Client Id, Event Id, Folder Id, Folder Name, Resource Id, Form Id, Client IP
-
Apps and Desktops: User Name, IP Address, Device Id, Jail Broken, Session Launch Type, Session Server Name, Session User Name, Download File Name, Download File Path, Printing Printer Name, Printing Job Details File Name, SaaS App Launch URL, Clipboard Operation, Clipboard Details Result
-
-
The custom report user interface is enhanced with support for pagination and a Clear All option for the filters.
For more information on how to create a custom report using these dimensions, see Custom reports.
Risk Indicators dashboard
The Risk Indicators dashboard is introduced on the Users page. It summarizes the top five default and custom risk indicators for a user. A See More link redirects you to the Risk Indicator Overview page. This page provides detailed information about the risk indicators generated for a selected time period.
For more information, see Users dashboard.
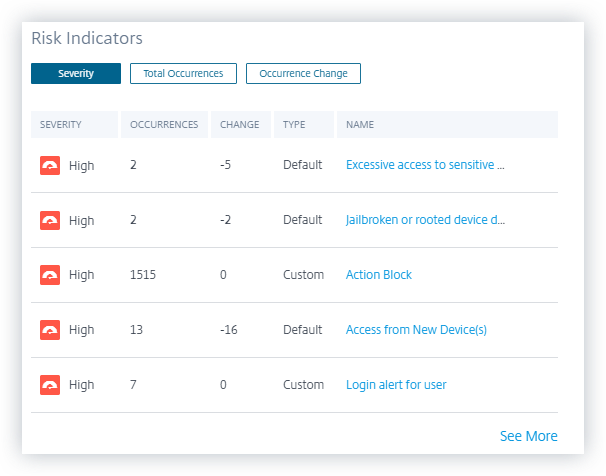
Risky Users dashboard enhancements
Citrix Analytics introduces the Risk Indicators and Risk Indicators Change tabs on the Risky Users dashboard. You can view the top five risky users based on these tabs. The dashboard also introduces the Risk Indicators column. It shows the number of risk indicators for a user.
The Risky Users page introduces the Occurrences and Occurrences Change columns. These columns summarize the total occurrences and the change in occurrences of the custom and the default risk indicators.
For more information, see Users dashboard.
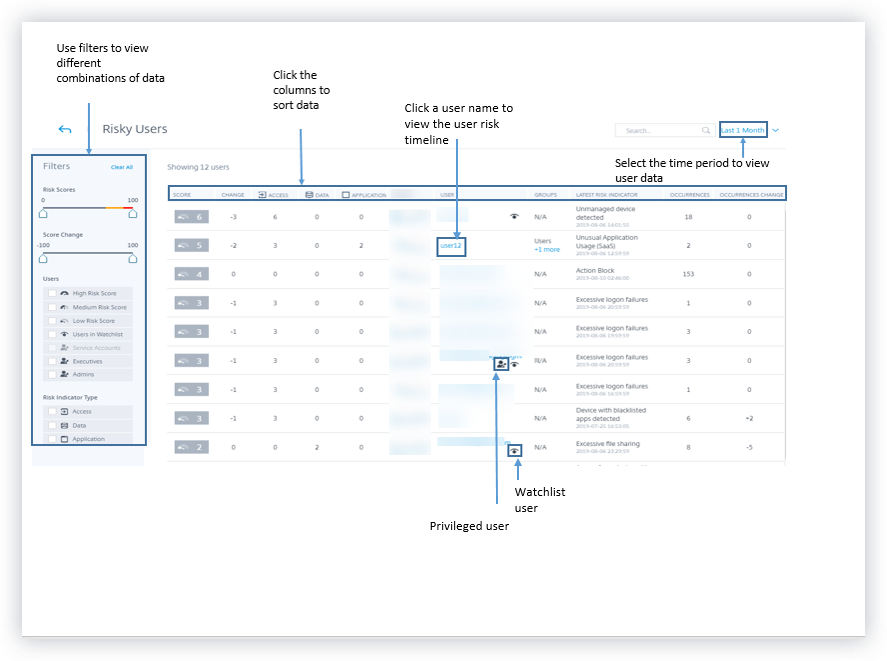
Share link risk indicator - Excessive downloads
Citrix Analytics detects access threats based on excessive downloads on a share link and triggers the Excessive downloads risk indicator. By identifying share links with excessive downloads, based on previous behavior, you can monitor the share link for potential attacks. This risk indicator helps you identify an excessive file download activity.
For more information, see Excessive downloads.
Self-service search for the Authentication data
Use self-service search to get insights into the authentication events. Citrix Analytics receives the authentication events such as user login, user logoff, and client update from the Identity and Access Management service of Citrix Cloud. The search provides a detailed report on the authentication events, helps you to identify any authentication issues, and troubleshoot them. You can also define a search query to retrieve events that match your defined criteria.
To view the events, select Authentication from the list, select the time period, and then click Search.
For more information, see Self-service search for Authentication.
July 11, 2019
New features
Custom risk indicators
The default risk indicators that Citrix Analytics generates are based on machine learning algorithms. Citrix Analytics now allows you to create custom risk indicators. Based on user events, you can define the conditions and create custom risk indicators.
When the defined conditions are met, Citrix Analytics generates the custom risk indicators similar to default risk indicators, and displays them on the user’s risk timeline. Custom risk indicators are denoted with a label on the user’s risk timeline.
For more information, see Custom risk indicators.
Privileged status on risk timeline
The user risk timeline displays the following events whenever there is a change in the Admin or Executive privilege status of a user:
-
Added to Executive group
-
Removed from Executive group
-
Privilege elevated to Admin
-
Admin privilege removed
When a risk indicator is triggered for a user, you can co-relate it with the specified privilege status change event. If necessary, you can apply appropriate actions on the user profile.
For more information, see User risk timeline.
Expire share link action
Citrix Analytics enables you to apply actions on share link risk indicators. Currently, the supported action is Expire share link.
For more information, see Citrix share link risk indicators.
Self-service search enhancements
-
Support for wild card character * in search query: Use the asterisk (*) character in your search query to match any character zero or more times. For example, the search query User-Name = “John*” displays events for the all user names that begin with John.
-
Added the Clear All option for facets: Click Clear All to remove all the selected facets at a time.
-
View hidden column data in the event list: After removing a column from the event table, you can view the corresponding data in the user event list. Expand the event row for a user and view the data.
For more information, see Self-service search.
Data error status on the site cards
The Site cards display the No data received label in red when Citrix Analytics does not receive events for the last one hour from the data source. It also displays the number of events received and is linked to the corresponding self-service search page. This feature helps you view the corresponding events on the self-service search page and check for any data transmission issues.
Note
Currently, self-service search is available only for the Access, Content Collaboration, and Apps and Desktop data sources.
For more information, see Enable Analytics on Citrix data sources.
Fixed issues
- For the Access Control data source, the number of events on the site card does not match the self-service search results. [CAS-18286]
June 19, 2019
Fixed issues
-
The Audit Log page displays the data transmission on or off status every time the Active Directory data source is discovered. [CAS-17575]
-
The time period menu on the Users dashboard does not load accurately. It displays a timeout error message. [CAS-19467]
-
Users get an error message on Citrix Analytics while connecting to a tenant from Splunk. Occasionally, onboarding of new data sources fails. [CAS-19429]
June 17, 2019
New features
StoreFront configuration
If your organization uses on-premises StoreFront, you can now configure StoreFront to connect to Citrix Analytics. Configuration is performed using a configuration file imported from Citrix Analytics. After the configuration is successful, Citrix Workspace app sends user events to Citrix Analytics for generating actionable insights into user behaviors. The insights help you to detect any anomalous user behaviors and proactively handle security threats in your organization. For more information, see Onboard Citrix Virtual Apps and Desktops on-premises sites using StoreFront.
May 30, 2019
New features
Excessive logon failures
Citrix Analytics detects access threats based on excessive logon activity and triggers the Excessive logon failures risk indicator. This risk indicator is triggered when a user experiences multiple failed logon attempts to access Content Collaboration. By identifying users with excessive logon failures, based on previous behavior, administrators can monitor the user’s account for brute force attacks.
Note
Excessive logon failures is now renamed as Excessive authentication failures.
Fixed issues
-
For some user events transmitted by Citrix Workspace apps, the data source is incorrectly identified as Endpoint Management instead of Citrix Virtual Apps and Desktops.
[CAS-17323]
-
The Users dashboard takes a long time to load for the Last 1 Month time period. This issue occurs when the number of users are high. In some instances, you might even encounter 601 errors.
[CAS-16300]
-
Citrix Content Collaboration is not discovered as a data source although some users subscribe to the service on Citrix Cloud.
[CAS-16299]
May 09, 2019
New features
Creating custom reports
You can now create custom reports based on your operational requirements. Citrix Analytics provides a list of dimensions and metrics according to the selected data source. Choose the required parameters and the visualization types such as bar chart, event chart, line chart, or table to create your reports. Creating reports help you to organize and analyze your data graphically.
To create a custom report, from the Security tab, click Reports > Create Report. To view your previously created reports, from the Security tab, click Reports. For more information, see Custom reports.
Privileged user monitoring
Citrix Analytics enables you to closely monitor the behavior anomalies of privileged users in an organization. As privileged users are highly vulnerable to security threats, it becomes challenging to distinguish their daily activities from the malicious ones. Hence, the malicious activities of privileged users remain undetected for a long time. This feature enables you to proactively monitor such activities and take appropriate actions on the appropriate user accounts. Privileged users are represented with an icon on the Users dashboard.
Citrix Analytics supports monitoring for the following types of privileged users:
-
Admins - Users who are assigned Admin privileges by the respective Citrix service. Currently, Citrix Analytics supports privileged user monitoring for users with Admin privileges in the Content Collaboration service.
-
Executives - On Citrix Analytics, you can mark an AD group as an Executives group. Marking an AD group as an Executive group makes all the users in the group as privileged users. If there is no need to further support the behavior anomalies of users in an AD group, you can remove the group as an Executive group.
For more information, see Privileged users.
Weekly email summary
Citrix Analytics sends a weekly email to the administrators summarizing the security risk exposures in their organization’s IT environment. The email notification is sent every Tuesday to the administrators and it highlights the security events that have occurred in the previous week. This email ensures that the administrators are informed about the security risk exposures without signing in to Citrix Analytics. For more information, see Weekly email summary.
April 26, 2019
New features
Delegated administrators
Citrix Analytics now supports delegated administrator roles. This functionality enables you to invite other administrators to your Citrix Cloud account to manage Citrix Analytics for your organization. If you are a Citrix Analytics administrator with full access permission, you can add other administrators to your Citrix Cloud account. These additional administrators are called delegated administrators. You can currently assign read-only access to the delegated administrators. For more information, see Delegated administrators.
Fixed issues
Few risk indicators for the data sources that use data streaming do not generate alerts. You do not get any alert notifications and policy-based actions are not applied automatically if any one of the following risk indicators is triggered:
-
Citrix Endpoint Management risk indicators - Unmanaged device, Jailbroken or rooted device, and Device with blacklisted apps.
-
Citrix Virtual Apps and Desktops risk indicator - Access from device with unsupported operating system (OS).
-
Citrix Content Collaboration risk indicator - Excessive access to sensitive files.
[CAS-14590]
February 19, 2019
New features
Splunk integration
Citrix Analytics integrates with Splunk to enhance your security incident monitoring and troubleshooting experiences. This integration augments your existing data sources with the risk analysis capabilities and intelligence of Citrix Analytics for Security such as risk indicators, risk scores, and user profiles. Citrix Analytics exports risk analysis information to a channel. Splunk pulls the same from this channel.
Splunk integration involves configuration on Citrix Analytics, installation of the Citrix Analytics Add-on for Splunk app, and configuration of the app. Ensure to turn on data processing for at least one data source. It helps Citrix Analytics to begin the Splunk integration process.
For more information, see Splunk integration.
Dynamic session recording
Citrix Analytics introduces the ability to trigger session recording dynamically on the users’ current Virtual Apps and Desktops sessions. It helps to capture evidences required for risk analysis and take appropriate incident response actions such as disconnect sessions and block user.
For more information, see Policies and actions.
Share Links dashboard and risk indicator
Citrix Analytics introduces the risk visibility to Share Links based on data collected from Citrix Content Collaboration. It helps you to understand the risk exposure of share links through the risk indicators that the share links trigger.
For more information, see Share Links dashboard.
Currently, the Anonymous sensitive share download risk indicator is triggered for a share link. When Content Collaboration detects this risky behavior, Citrix Analytics receives the events. You are notified in the Alerts panel and the Anonymous sensitive share download risk indicator is added to the share link’s risk timeline.
For more information, see Share Link risk timeline and Citrix Share Link risk indicators.
Microsoft Active Directory integration
You can now integrate Microsoft Active Directory with Citrix Analytics. This integration enhances the context of risky users with additional information such as job title, organization, office location, email, and contact details. You can get a better visibility of a user on the user profile page in Citrix Analytics.
For more information, see Integrate Analytics with Microsoft Active Directory.

January 04, 2019
New features
Addition of SOURCE column for existing risk indicators
The SOURCE column has been introduced in the EVENT DETAILS section for the following risk indicators:
-
Excessive file uploads
-
Excessive file downloads
-
Excessive file sharing
-
Excessive file or folder deletion
For more information, see Citrix Content Collaboration risk indicators.
Advanced user profile
The User Info view on the user profile has been enhanced. The Trend View link has been introduced at the top right corner of the Application, Devices, and Data Usage sections. The Map View link has been introduced at the top right corner of the Locations section. These links provide a graphic representation about the user’s historical behavior during a specific time period. You can navigate to User Info from the user’s risk timeline or from the Data Sources page.
Note
The Authentication and Domains data are currently not available on the User Info profile.
For more information, see User risk timeline and profile.

Microsoft Graph Security risk indicators
The onboarded Microsoft Graph Security can receive risk indicator details from one of the following security providers, and forwards it to Citrix Analytics:
-
Azure AD Identity Protection
-
Microsoft Defender for Endpoint
For more information, see Microsoft Graph Security risk indicators.
Ways to enter the self-service search page
You can now access the self-service search page using the following options:
-
Top bar: Click Search on the top bar to directly access the search page.

-
Risk timeline on user profile page: Click Event Search to access the search page and view the events corresponding to a specific user’s risk indicator and the data source. For more information, see Self-service search.
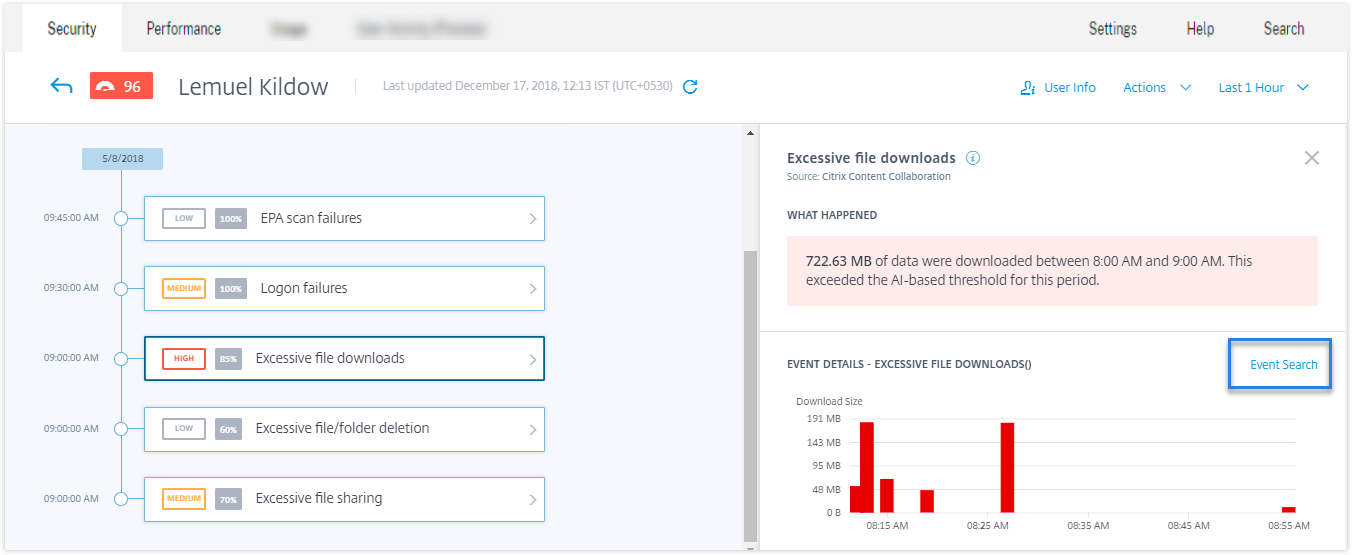
Self-service search for Content Collaboration
Use self-service search to get insight into the events associated with the Content Collaboration data source. To view the events, select Content Collaboration from the list, select the time period, and then click Search. For more information, see Self-service search for Content Collaboration.
Self-service search for Apps and Desktops
Use self-service search to get insight into the events associated with the Apps and Desktops data source. To view the events, select Apps and Desktops from the list, select the time period, and then click Search. For more information, see Self-service search for Apps and Desktops.
Export self-service search events to CSV file
You can now export the self-service search events to a CSV file and download the file for future use. For more information, see Self-service search.
Improved onboarding for Citrix Virtual Apps and Desktops
The onboarding process for the Citrix Virtual Apps and Desktops data source is now improved to provide a better user experience. The site cards and the on boarding steps have been modified. For more information, see Citrix Virtual Apps and Desktops and Citrix DaaS data source.
November 29, 2018
New features
Microsoft Security Graph data source
Microsoft Graph Security is an external data source that aggregates data from multiple security providers. It also provides access to the user inventory data.
Citrix Analytics currently supports the Azure AD identity protection and Microsoft Defender for Endpoint security providers associated with this data source.
To onboard this data source, you must obtain permissions from the Microsoft identity platform. For more information, see Microsoft Graph Security.
View event details and discovered users on the site cards for data sources
The site cards for the data sources now display event details and the number of users. For example, you can view the event details and the users for Access Control on the site card. For more information, see Enable Analytics on data sources.
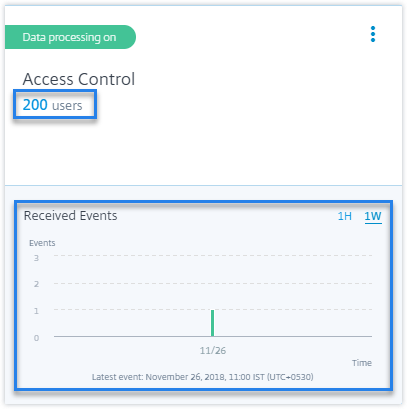
November 16, 2018
New features
Self-service search for access data
You can use self-service search to get insight into the access details for the users in your enterprise. Citrix Analytics collects the users’ access details from the Citrix Access Control service. Use the facets and the search query to narrow down your search results.
To use the self-service search page, from the Security tab, click Event Search.
For more information, see Self-service search for Access.
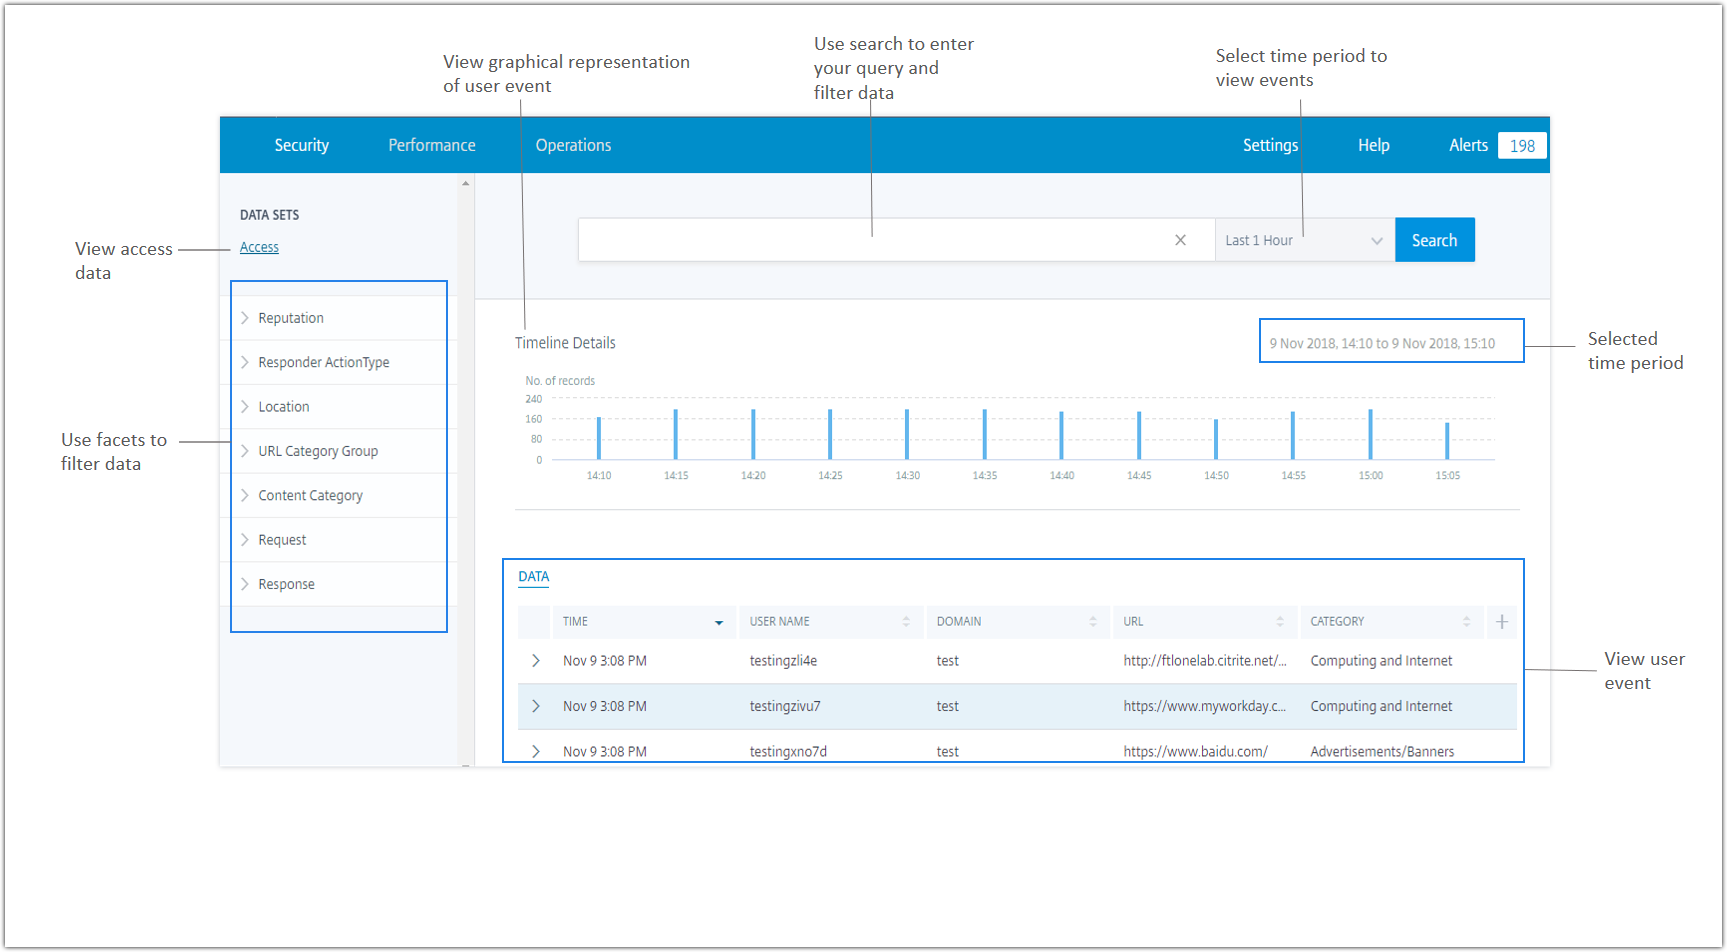
Risk indicator feedback
Using the risk indicator feedback feature on Citrix Analytics, you can provide feedback regarding a risk indicator. Your feedback helps to confirm if the security incident reported is accurate or not.
Currently, this feature is supported on the Unusual logon access risk indicator triggered by the Content Collaboration data source. If this risk indicator triggered is incorrect, you can report it as a false positive and provide feedback. You can also edit feedback that you have previously submitted. Citrix Analytics captures your feedback and validates the predicted information to optimize the anomalous behavior detection.
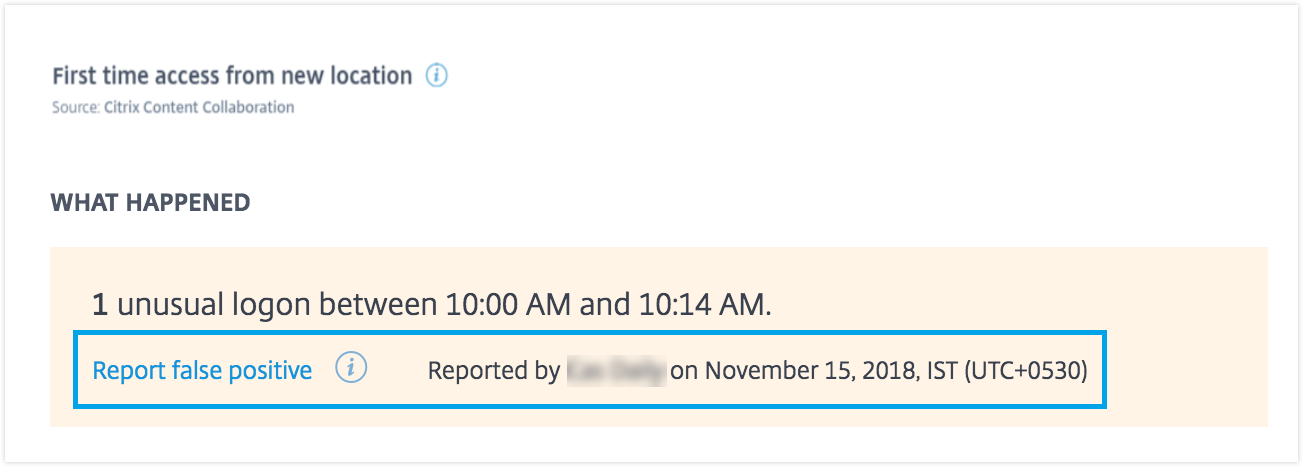
Fixed issues
- You cannot edit and save a policy if you are accessing Citrix Analytics using Internet Explorer 11.0.
In this article
- April 15, 2024
- January 29, 2024
- January 25, 2024
- January 24, 2024
- December 01, 2023
- November 30, 2023
- September 22, 2023
- July 04, 2023
- June 15, 2023
- June 14, 2023
- June 08, 2023
- May 29, 2023
- May 24, 2023
- May 04, 2023
- April 13, 2023
- March 31, 2023
- March 30, 2023
- March 24, 2023
- March 21, 2023
- February 23, 2023
- February 22, 2023
- February 16, 2023
- February 03, 2023
- January 11, 2023
- December 27, 2022
- December 13, 2022
- December 05, 2022
- November 18, 2022
- November 08, 2022
- October 19, 2022
- October 18, 2022
- October 14, 2022
- September 26, 2022
- September 13, 2022
- September 09, 2022
- August 19, 2022
- August 18, 2022
- August 17, 2022
- August 11, 2022
- June 17, 2022
- June 09, 2022
- June 02, 2022
- May 24, 2022
- May 17, 2022
- April 05, 2022
- March 21, 2022
- March 10, 2022
- March 03, 2022
- February 23, 2022
- February 17, 2022
- February 10, 2022
- February 09, 2022
- January 28, 2022
- January 20, 2022
- January 18, 2022
- December 23, 2021
- December 21, 2021
- December 20, 2021
- December 09, 2021
- December 07, 2021
- December 02, 2021
- November 29, 2021
- November 26, 2021
- November 25, 2021
- November 09, 2021
- November 02, 2021
- October 20, 2021
- October 19, 2021
- October 01, 2021
- September 29, 2021
- September 15, 2021
- September 14, 2021
- August 19, 2021
- July 29, 2021
- July 14, 2021
- July 06, 2021
- July 01, 2021
- June 30, 2021
- June 23, 2021
- June 07, 2021
- May 18, 2021
- April 29, 2021
- April 16, 2021
- March 26, 2021
- March 18, 2021
- March 11, 2021
- March 03, 2021
- February 18, 2021
- January 27, 2021
- January 20, 2021
- January 19, 2021
- January 13, 2021
- January 11, 2021
- December 17, 2020
- December 07, 2020
- November 30, 2020
- November 04, 2020
- October 20, 2020
- October 15, 2020
- September 10, 2020
- September 08, 2020
- August 11, 2020
- July 31, 2020
- July 09, 2020
- June 26, 2020
- June 02, 2020
- May 11, 2020
- April 29, 2020
- April 02, 2020
- March 04, 2020
- February 20, 2020
- January 09, 2020
- December 12, 2019
- December 04, 2019
- November 22, 2019
- November 08, 2019
- October 21, 2019
- September 23, 2019
- August 30, 2019
- August 20, 2019
- July 11, 2019
- June 19, 2019
- June 17, 2019
- May 30, 2019
- May 09, 2019
- April 26, 2019
- February 19, 2019
- January 04, 2019
- November 29, 2018
- November 16, 2018