Diagnose Session Performance issues
The Session Performance tab on the User Details Page has enhanced troubleshooting workflows to help identify issues within HDX™ user sessions. The Session Topology and Performance Metrics panels help correlate the component view and multiple performance metrics of a session in a single view and reduces the mean time for resolution of session experience issues.

End-to-end Network Hop view
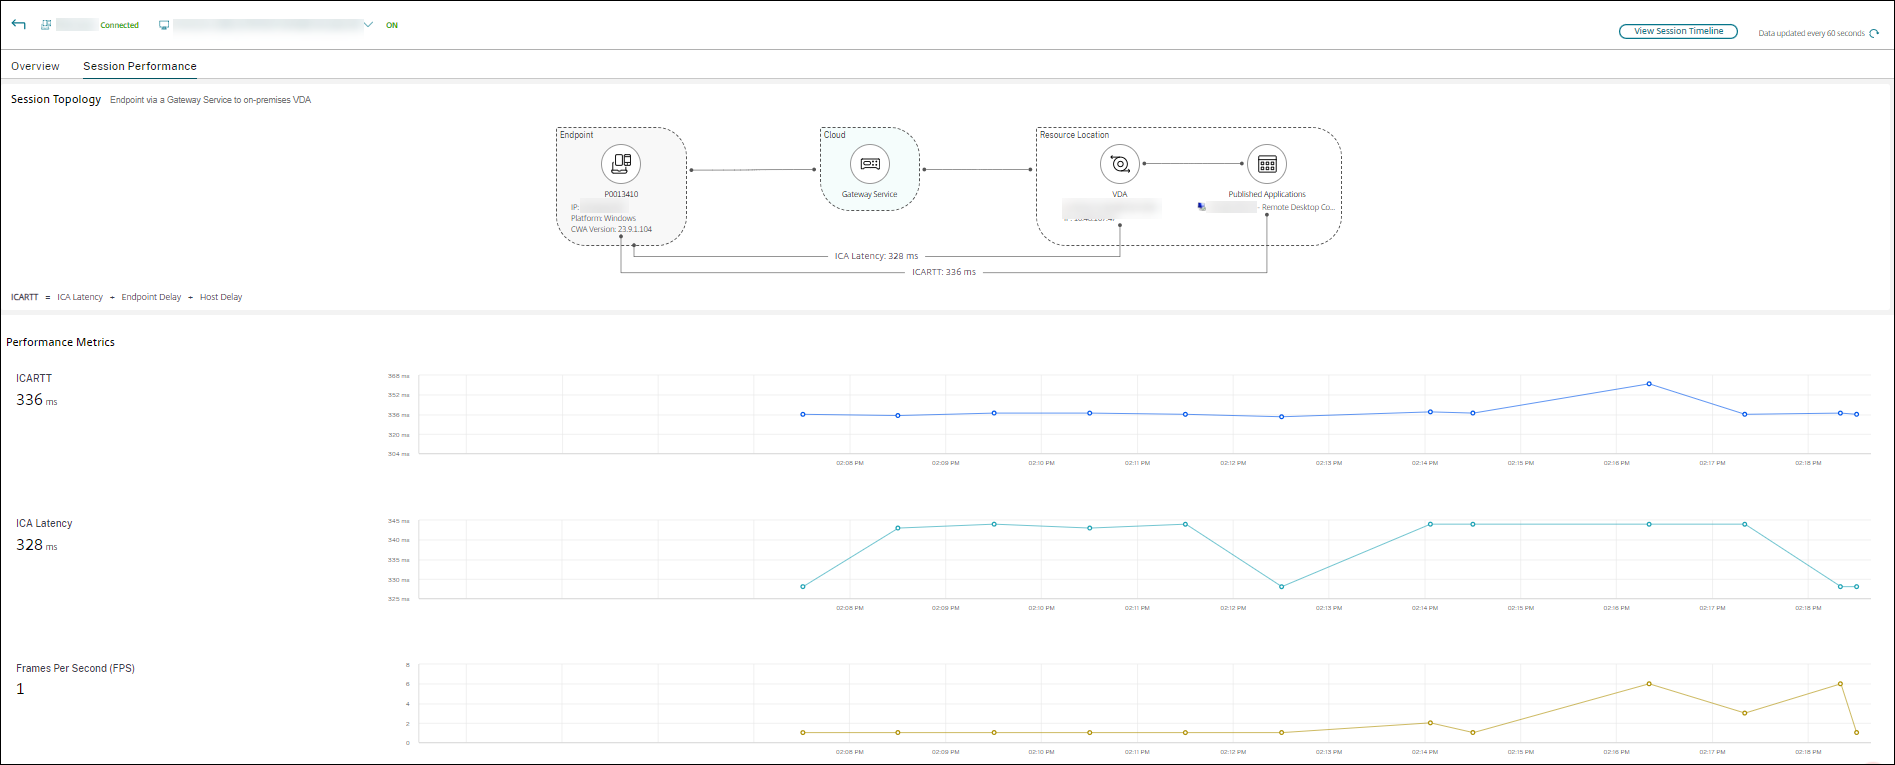
End-to-end network hop view is the next step towards enhancing troubleshooting workflows. The User Details > Session Performance > Session Topology section provides a visual representation of the end-to-end network hop view for connected HDX sessions.
Session Topology for a connected session shows the components involved in the session path with their metadata, the link between the components, and the applications published on the VDA. In addition, the following session performance metrics for are displayed for the session:
- ICA® Latency - Latency is basically the network latency. This parameter indicates if the network is sluggish.
- ICA RTT - ICARTT is the time interval between a user’s action and the graphical response displayed on their screen. This measurement includes ICA Latency, Endpoint Delay, and Host Delay.
You can use this view to understand the components through which the session data flows and identify the specific hop that might be bringing in performance issues.
The performance metrics on the Session Topology view are available only for HDX session in the connected state.
Session Topology scenarios
Depending on the deployment scenario of the site, the components involved in a session are all or any of the following:
- Citrix Workspace™ app on Endpoint
- Gateway service/ on-premises Gateway
- Cloud Connector – Gateway is connected to DaaS via a Cloud Connector in the case of hybrid connections.
- VDAs
Accordingly, the possible network topologies are as follows:
- Citrix Workspace app on the endpoint connects via Citrix Workspace and Gateway Service to an on-premises VDA. No Cloud Connector is used to connect to VDA.

- Citrix Workspace app on the endpoint connects via Citrix Workspace and Gateway Service to an on-premises VDA via Cloud Connector.

- Citrix Workspace app on the endpoint connects via StoreFront™ and on-premises Gateway to on-premises VDA.

- Citrix Workspace app on the endpoint connects via StoreFront to on-premises VDA.

Performance Metrics
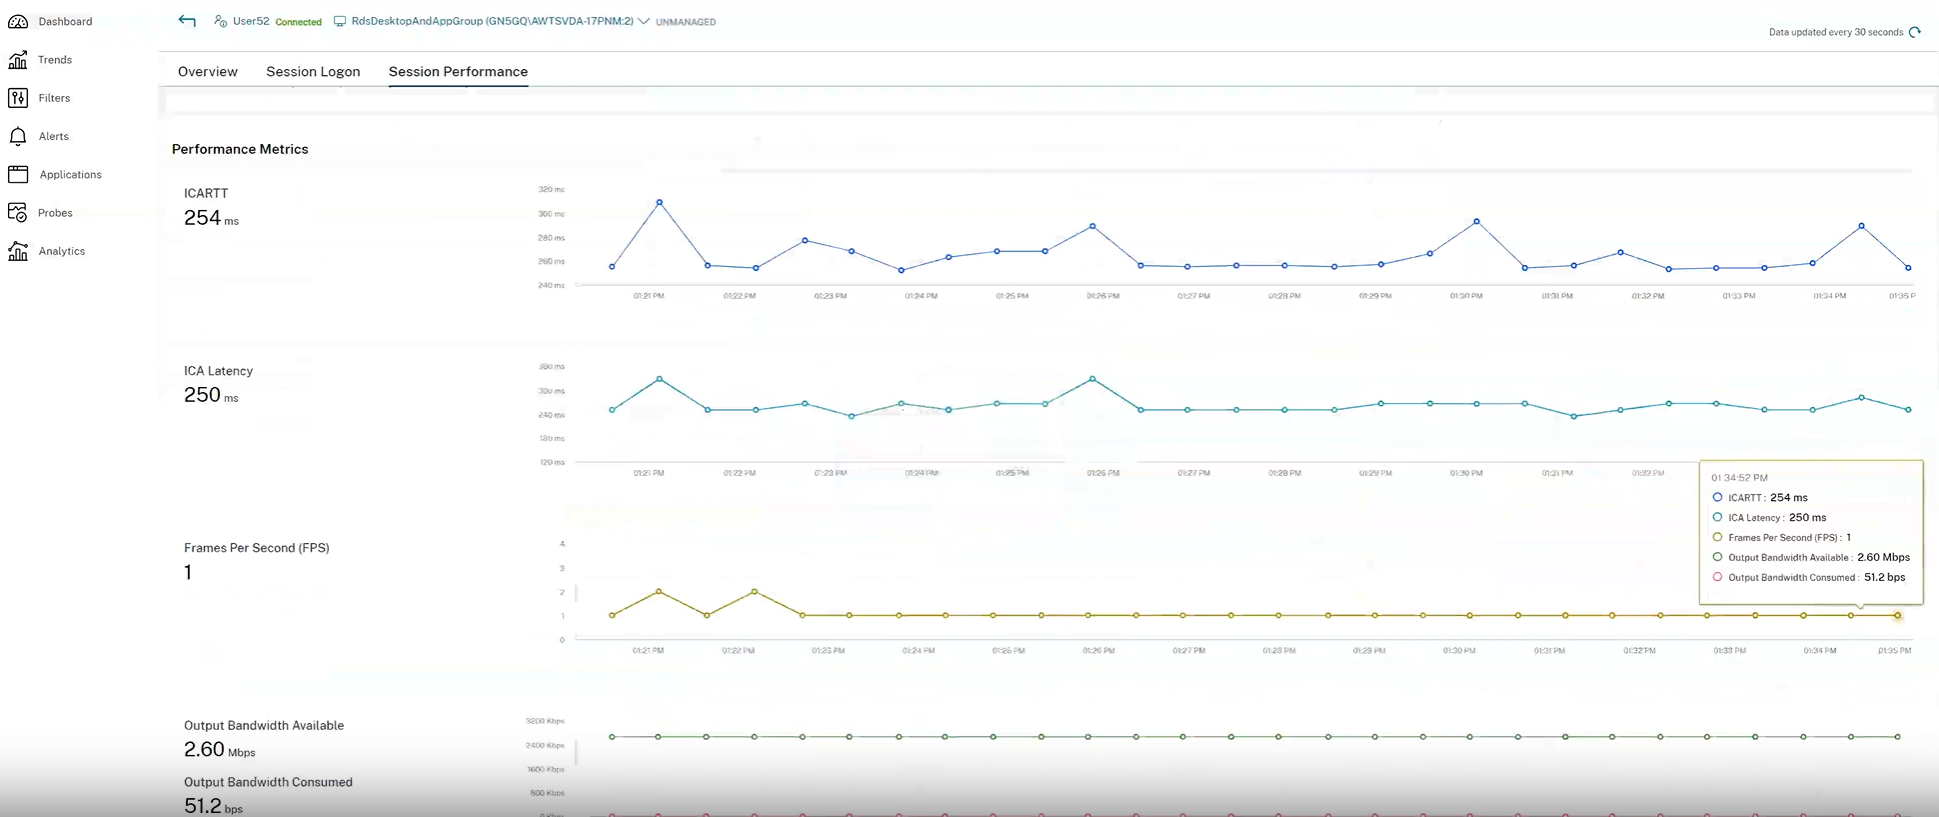
The Performance Metrics panel offers the ability to correlate real-time metrics in identifying issues within user sessions. Trends for the session metrics help indicate how these metrics have performed over time. When you click the Session Performance tab, along with the real-time data, you can view the last 15 minutes data without waiting for the page load time. The plots help to correlate multiple component performance metrics in a single view.

Note:
With the trailing 15 minutes metrics support, the graph is plotted for the duration for which the session is connected and disconnected. The disconnected session’s metric is displayed with the value zero.
Apart from ICARTT and ICA Latency, the following metrics are available:
- Frames Per Second - Frames Per Second is an important metric that indicates the session responsiveness. Output Bandwidth Available - Output Bandwidth Available is a measure of the total bandwidth available to transmit data from the VDA to the endpoint.
- Output Bandwidth Consumed - Output Bandwidth Consumed indicates the actual amount of data transmitted from the VDA to the endpoint to display sessions to users.
Analyzing Output Bandwidth Available and the Output Bandwidth Consumed helps check if sufficient bandwidth is available to serve sessions and to detect if a session is affected by insufficient bandwidth.