Alerts and notifications
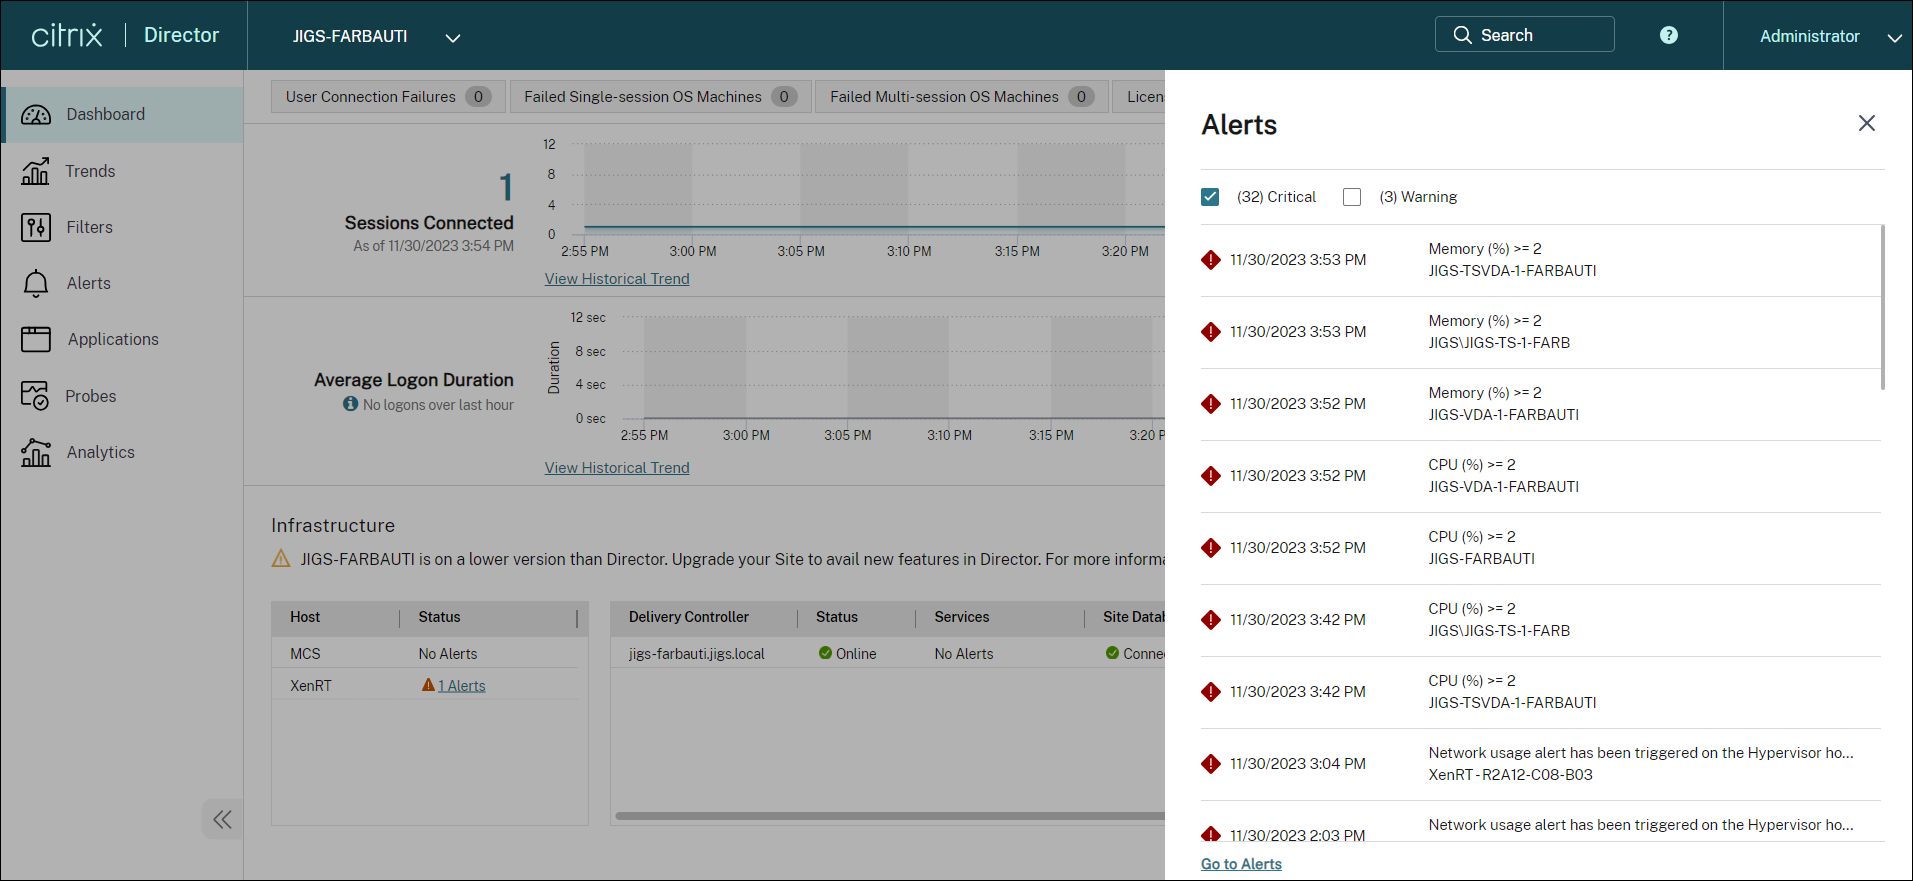
Alerts are displayed in Director on the dashboard and other high level views with warning and critical alert symbols. Alerts are available for Premium licensed sites. Alerts update automatically every minute; you can also update alerts on demand.

A warning alert (amber triangle) indicates that the warning threshold of a condition has been reached or exceeded.
A critical alert (red circle) shows that the critical threshold of a condition has been reached or exceeded.
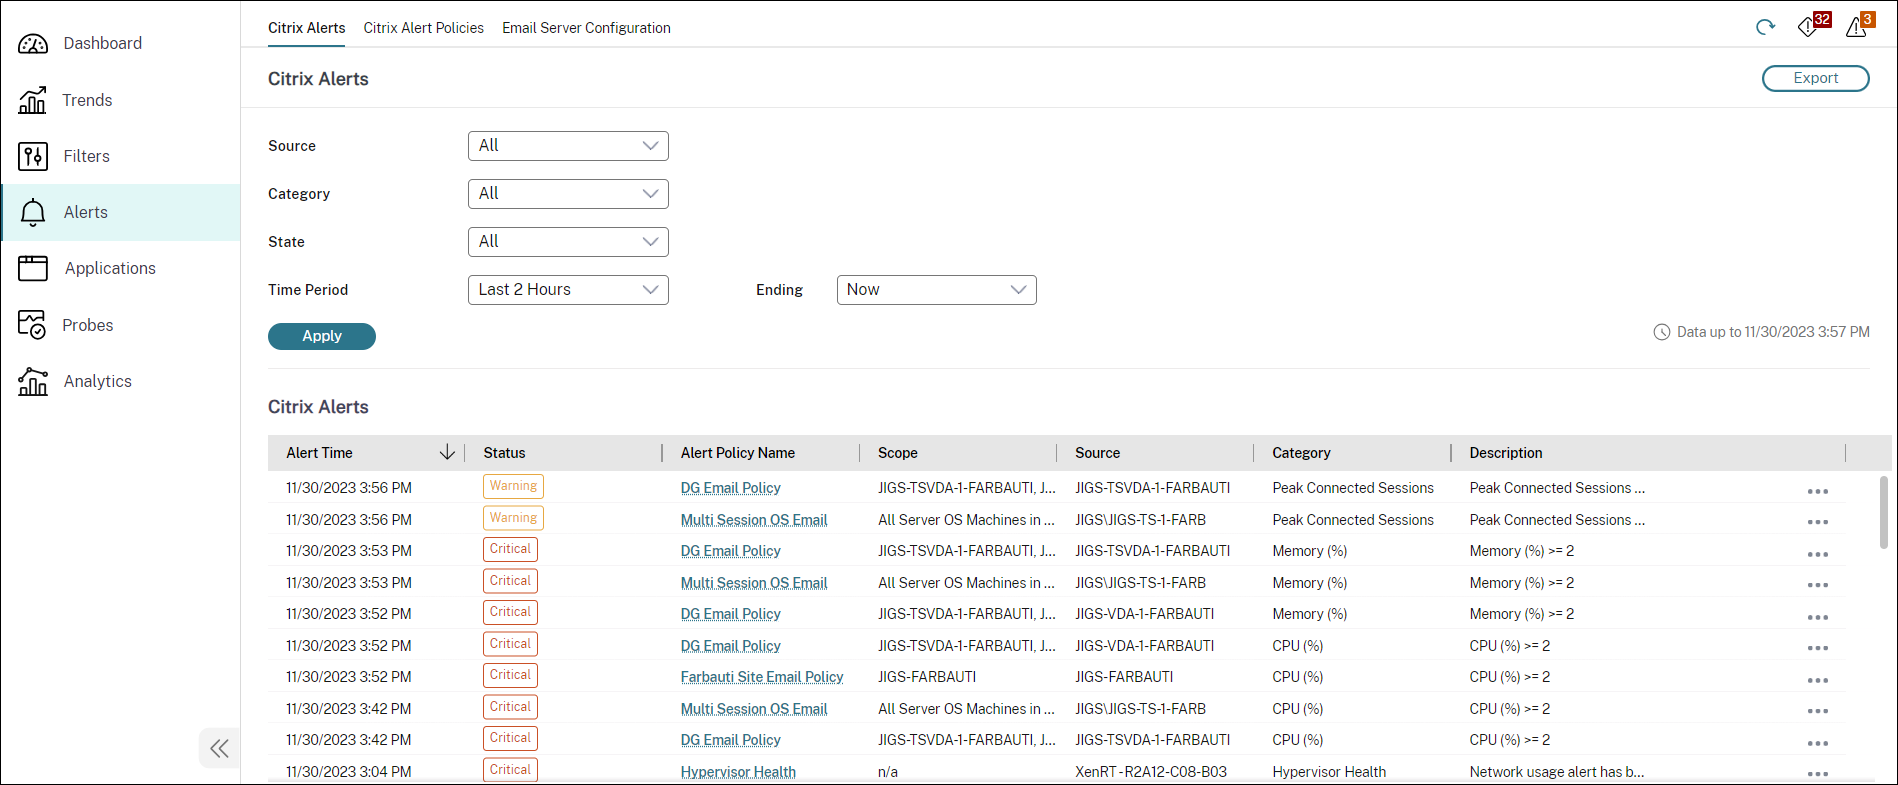
You can view more detailed information on alerts by selecting an alert from the sidebar, clicking the Go to Alerts link at the bottom of the sidebar or by selecting Alerts from the top of the Director page.
In the Alerts view, you can filter and export alerts. For example, Failed Multi-session OS machines for a specific Delivery Group over the last month, or all alerts for a specific user. For more information, see Export reports.

Citrix® alerts
Citrix alerts are alerts monitored in Director that originate from Citrix components. You can configure Citrix alerts within Director in Alerts > Citrix Alerts Policy. As part of the configuration, you can set notifications to be sent by email to individuals and groups when alerts exceed the thresholds you have set up. For more information on setting up Citrix Alerts, see Create alerts policies.
Note:
Ensure that your firewall, proxy, or Microsoft Exchange Server do not block the email alerts.
Smart alert policies
A set of built-in alert policies with predefined threshold values is available for Delivery Groups and Multi-session OS VDA scope. This feature requires Delivery Controller(s) version 7.18 or later. You can modify the threshold parameters of the built-in alert policies in Alerts > Citrix Alerts Policy. These policies are created when there is at least one alert target -a Delivery Group or a Multi-session OS VDA defined in your site. Additionally, these built-in alerts are automatically added to a new delivery group or a Multi-session OS VDA.
In case you upgrade Director and your site, the alert policies from your previous Director instance are carried over. Built-in alert policies are created only if no corresponding alert rules exist in the Monitor database.
For the threshold values of the built-in alert policies, see the Alerts policies conditions section.

Create alerts policies

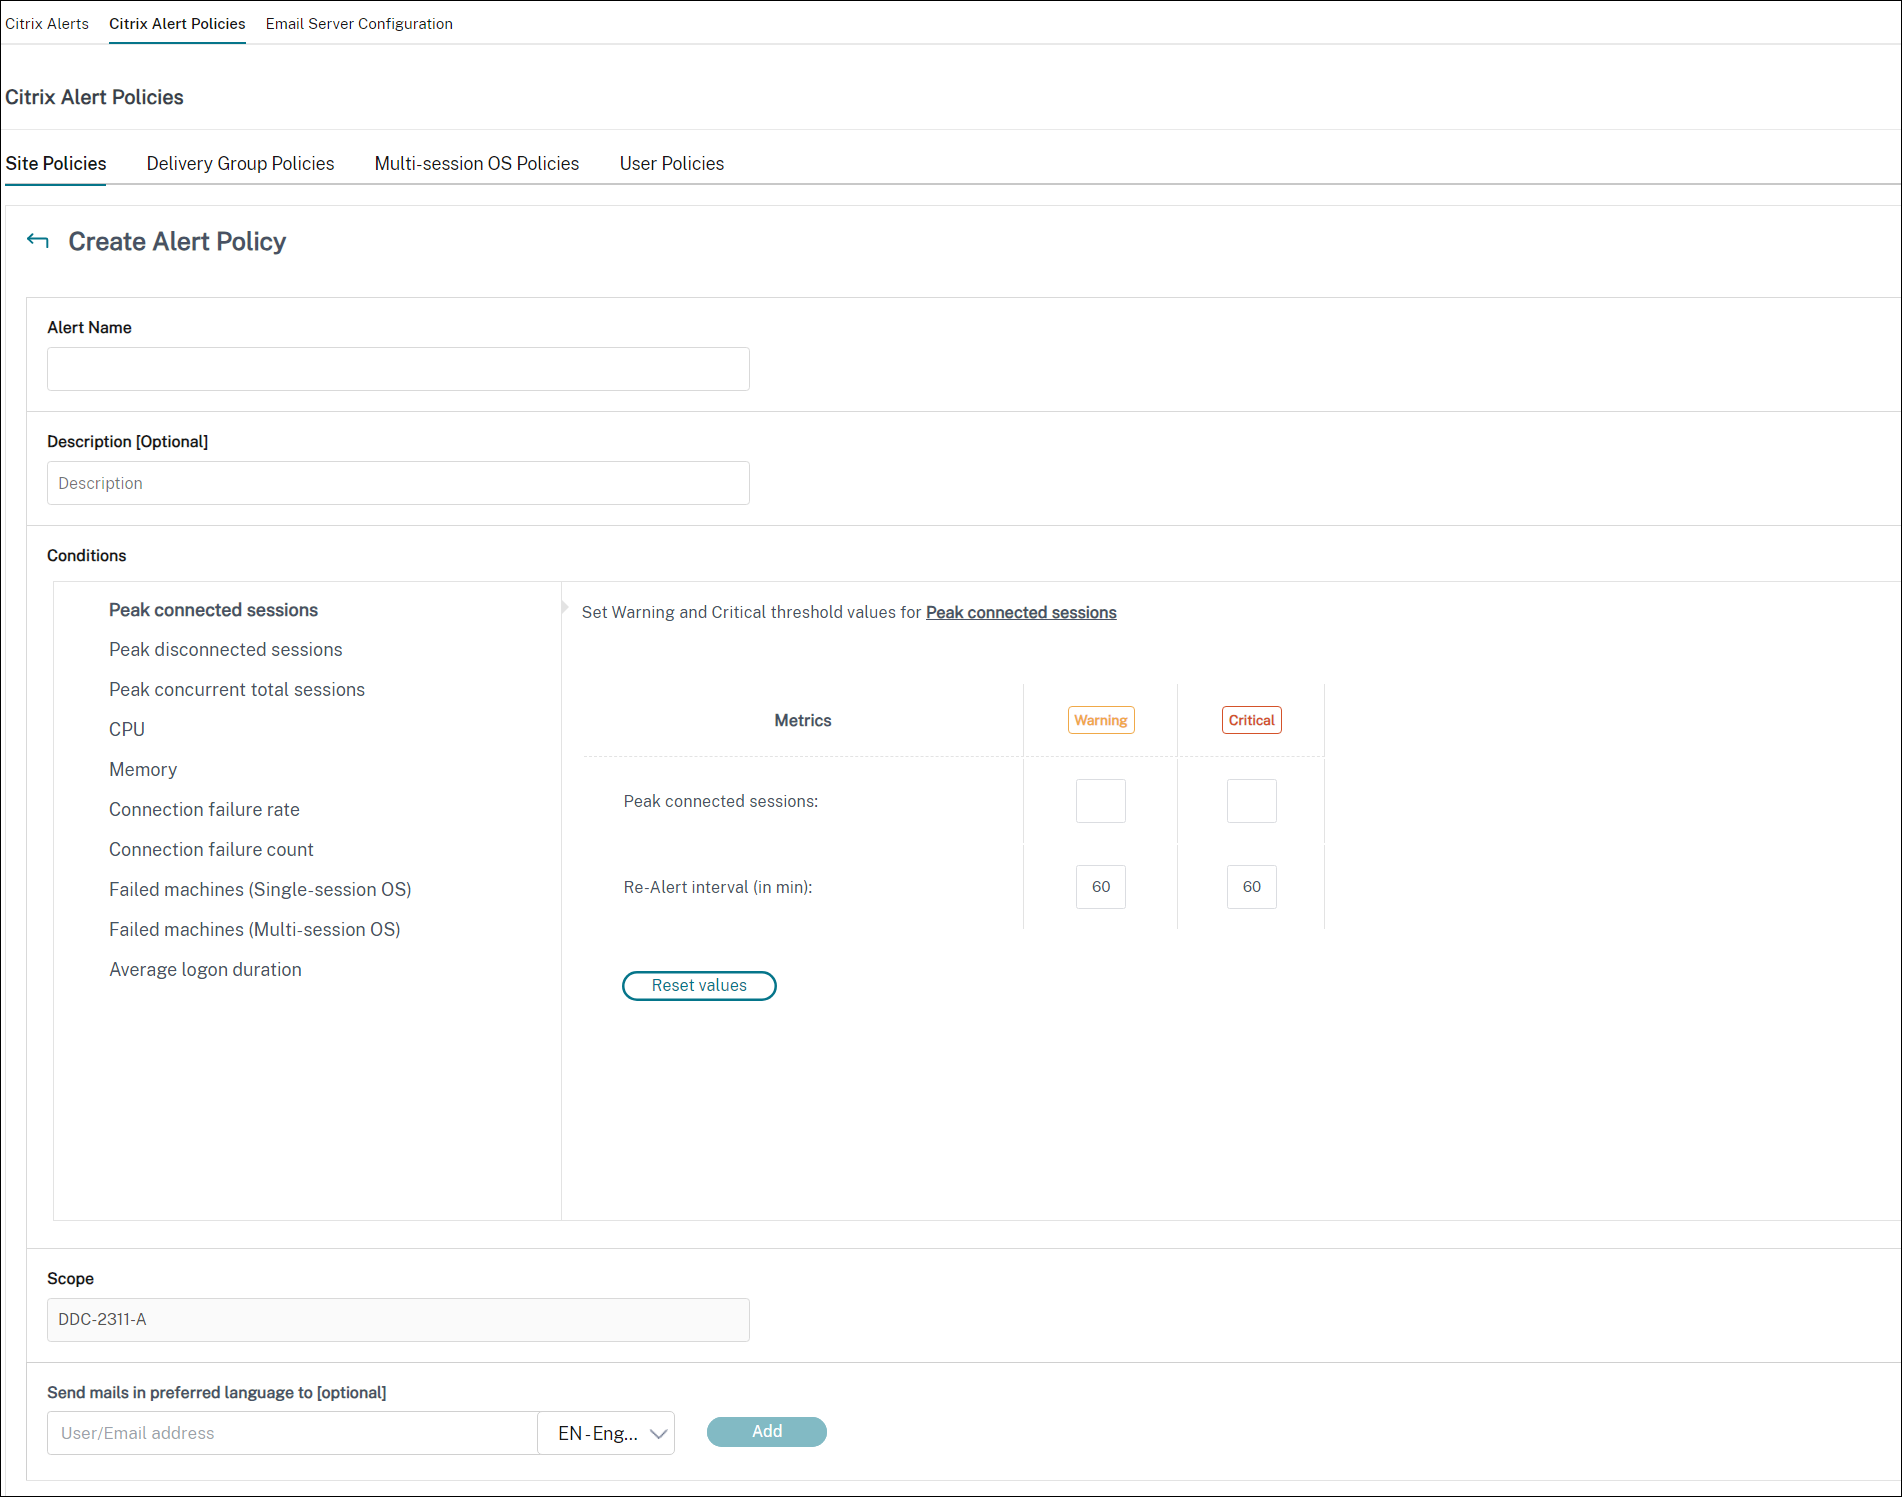
To create a new alerts policy, for example, to generate an alert when a specific set of session count criteria is met:
- Go to Alerts > Citrix Alerts Policy and select, for example, Multi-session OS Policy.
- Click Create.
- Name and describe the policy, then set the conditions that have to be met for the alert to be triggered. For example, specify Warning and Critical counts for Peak Connected Sessions, Peak Disconnected Sessions, and Peak Concurrent Total Sessions. Warning values must not be greater than Critical values. For more information, see Alerts policies conditions.
- Set the Re-alert interval. If the conditions for the alert are still met, the alert is triggered again at this time interval and, if set up in the alert policy, an email notification is generated. A dismissed alert does not generate an email notification at the re-alert interval.
- Set the Scope. For example, set for a specific Delivery Group.
- In Notification preferences, specify who should be notified by email when the alert is triggered. You have to specify an email server on the Email Server Configuration tab in order to set email Notification preferences in Alerts Policies.
- Click Save.
Creating a policy with 20 or more Delivery Groups defined in the Scope might take approximately 30 seconds to complete the configuration. A spinner is displayed during this time.
Creating more than 50 policies for up to 20 unique Delivery Groups (1000 Delivery Group targets in total) might result in an increase in response time (over 5 seconds).
Moving a machine containing active sessions from one Delivery Group to another might trigger erroneous Delivery Group alerts that are defined using machine parameters.
Note: After you delete an alert policy, it might take up to 30 minutes for the alert notifications generated by the policy to stop.
Alerts policies conditions
Find below the alert categories, recommended actions to mitigate the alert, and built-in policy conditions if defined. The built-in alert policies are defined for alert and realert intervals of 60 minutes.
Peak Connected Sessions
- Check Director Session Trends view for peak connected sessions.
- Check to ensure that there is enough capacity to accommodate the session load.
- Add new machines if needed
Peak Disconnected Sessions
- Check Director Session Trends view for peak disconnected sessions.
- Check to ensure that there is enough capacity to accommodate session load.
- Add new machines if needed.
- Log off disconnected sessions if needed
Peak Concurrent Total Sessions
- Check Director Session Trends view in Director for peak concurrent sessions.
- Check to ensure that there is enough capacity to accommodate session load.
- Add new machines if needed.
- Log off disconnected sessions if needed
CPU
Percentage of CPU usage indicates the overall CPU consumption on the VDA, including that of the processes. You can get more insight into the CPU utilization by individual processes from the Machine details page of the corresponding VDA.
- Go to Machine Details > View Historical Utilization > Top 10 Processes, identify the processes consuming CPU. Ensure that process monitoring policy is enabled to initiate collection of process level resource usage statistics.
- End the process if necessary.
- Ending the process causes unsaved data to be lost.
-
If all is working as expected, add additional CPU resources in the future.
Note:
The policy setting, Enable resource monitoring is allowed by default for the monitoring of CPU and memory performance counters on machines with VDAs. If this policy setting is disabled, alerts with CPU and memory conditions are not triggered. For more information, see Monitoring policy settings
Smart policy conditions:
- Scope: Delivery Group, Multi-session OS scope
- Threshold values: Warning - 80%, Critical - 90%
Memory
Percentage of Memory usage indicates the overall memory consumption on the VDA, including that of the processes. You can get more insight into the memory usage by individual processes from the Machine details page of the corresponding VDA.
- Go to Machine Details > View Historical Utilization > Top 10 Processes, identify the processes consuming memory. Ensure that process monitoring policy is enabled to initiate collection of process level resource usage statistics.
- End the process if necessary.
- Ending the process causes unsaved data to be lost.
-
If all is working as expected, add additional memory in the future.
Note:
The policy setting, Enable resource monitoring, is allowed by default for the monitoring of CPU and memory performance counters on machines with VDAs. If this policy setting is disabled, alerts with CPU and memory conditions are not triggered. For more information, see Monitoring policy settings
Smart policy conditions:
- Scope: Delivery Group, Multi-session OS scope
- Threshold values: Warning - 80%, Critical - 90%
Connection Failure Rate
Percentage of connection failures over the last hour.
- Calculated based on the total failures to total connections attempted.
- Check Director Connection Failures Trends view for events logged from the Configuration log.
- Determine if applications or desktops are reachable.
Connection Failure Count
Number of connection failures over the last hour.
- Check Director Connection Failures Trends view for events logged from the Configuration log.
- Determine if applications or desktops are reachable.
ICA® RTT (Average)
Average ICA round-trip time.
- Check Citrix ADM for a breakdown of the ICA RTT to determine the root cause. For more information, see Citrix ADM documentation.
- If Citrix ADM is not available, check the Director User Details view for the ICA RTT and Latency, and determine if it is a network problem or an issue with applications or desktops.
ICA RTT (No. of Sessions)
Number of sessions that exceed the threshold ICA round-trip time.
- Check Citrix ADM for the number of sessions with high ICA RTT. For more information, see Citrix ADM documentation.
-
If Citrix ADM is not available, work with the network team to determine the root cause.
Smart policy conditions:
- Scope: Delivery Group, Multi-session OS scope
- Threshold values: Warning - 300 ms for 5 or more sessions, Critical - 400ms for 10 or more sessions
ICA RTT (% of Sessions)
Percentage of sessions that exceed the average ICA round-trip time.
- Check Citrix ADM for the number of sessions with high ICA RTT. For more information, see Citrix ADM documentation.
- If Citrix ADM is not available, work with the network team to determine the root cause.
ICA RTT (User)
ICA round-trip time that is applied to sessions launched by the specified user. The alert is triggered if ICA RTT is greater than the threshold in at least one session.
Failed Machines (Single-session OS)
Number of failed Single-session OS machines. Failures can occur for various reasons as shown in the Director Dashboard and Filters views.
-
Run Citrix Scout diagnostics to determine the root cause.
Smart policy conditions:
- Scope: Delivery Group, Multi-session OS scope
- Threshold values: Warning - 1, Critical - 2
Failed Machines (Multi-session OS)
Number of failed Multi-session OS machines. Failures can occur for various reasons as shown in the Director Dashboard and Filters views.
-
Run Citrix Scout diagnostics to determine the root cause.
Smart policy conditions:
- Scope: Delivery Group, Multi-session OS scope
- Threshold values: Warning - 1, Critical - 2
Failed Machines (in %)
Percentage of failed single-session and multi-session OS machines in a delivery group calculated based on the number of failed machines. This alert condition allows you to configure alert thresholds as a percentage of failed machines in a delivery group and is calculated every 30 seconds. Failures can occur for various reasons as shown in the Director Dashboard and Filters views. Run Citrix Scout diagnostics to determine the root cause. For more information, see Troubleshoot user issues.
Average Logon Duration
Average logon duration for logons that occurred over the last hour.
- Check the Director Dashboard to get up-to-date metrics regarding the logon duration. A large number of users logging in during a short timeframe can increase the logon duration.
-
Check the baseline and break down of the logons to narrow down the cause. For more information, see Diagnose user logon issues
Smart policy conditions:
- Scope: Delivery Group, Multi-session OS scope
- Threshold values: Warning - 45 seconds, Critical - 60 seconds
Logon Duration (User)
Logon duration for logons for the specified user that occurred over the last hour.
Load Evaluator Index
Value of the Load Evaluator Index over the last 5 minutes.
-
Check Director for Multi-session OS Machines that might have a peak load (Max load). View both Dashboard (failures) and Trends Load Evaluator Index report.
Smart policy conditions:
- Scope: Delivery Group, Multi-session OS scope
- Threshold values: Warning - 80%, Critical - 90%
Hypervisor Alerts Monitoring
Director displays alerts to monitor hypervisor health. Alerts from XenServer® and VMware vSphere help monitor hypervisor parameters and states. The connection status to the hypervisor is also monitored to provide an alert if the cluster or pool of hosts is rebooted or unavailable.

To receive hypervisor alerts, ensure that a hosting connection is created in Web Studio. For more information, see Connections and resources. Only these connections are monitored for hypervisor alerts.
These alerts are displayed once the thresholds are reached or exceeded. Hypervisor alerts can be:
- Critical—critical threshold of the hypervisor alarm policy reached or exceeded
- Warning—warning threshold of the hypervisor alarm policy reached or exceeded
- Dismissed—alert no longer displayed as an active alert

This feature requires Delivery Controller™ version 7 1811 or later. If you are using an older version of Director with sites 7 1811 or later, only the hypervisor alert count is displayed. To view the alerts, you must upgrade Director.
The following table describes the various parameters and states of Hypervisor alerts.
| Alert | Supported Hypervisors | Triggered by | Condition | Configuration |
|---|---|---|---|---|
| CPU usage | XenServer, VMware vSphere | Hypervisor | CPU usage alert threshold is reached or exceeded | Alert thresholds must be configured in the Hypervisor. |
| Memory usage | XenServer, VMware vSphere | Hypervisor | Memory usage alert threshold is reached or exceeded | Alert thresholds must be configured in the Hypervisor. |
| Network usage | XenServer, VMware vSphere | Hypervisor | Network usage alert threshold is reached or exceeded | Alert thresholds must be configured in the Hypervisor. |
| Disk usage | VMware vSphere | Hypervisor | Disk usage alert threshold is reached or exceeded | Alert thresholds must be configured in the Hypervisor. |
| Host connection or power state | VMware vSphere | Hypervisor | Hypervisor Host has been rebooted or is unavailable | Alerts are prebuilt in VMware vSphere. No additional configurations are needed. |
| Hypervisor connection unavailable | XenServer, VMware vSphere | Delivery Controller | Connection to the hypervisor (pool or cluster) is lost or powered down or rebooted. This alert is generated every hour as long as the connection is unavailable. | Alerts are prebuilt with the Delivery Controller. No additional configurations are needed. |
Note:
For more information about configuring alerts, see Citrix XenCenter Alerts or check the VMware vCenter Alerts documentation.
Email notification preference can be configured under Citrix Alerts Policy > Site Policy > Hypervisor Health. The threshold conditions for Hypervisor alert policies can be configured, edited, disabled, or deleted from the hypervisor only and not from Director. However, modifying email preferences and dismissing an alert can be done in Director. You can disable the alert if your role does not involve infrastructure monitoring.
Important:
- Alerts triggered by the Hypervisor are fetched and displayed in Director. However, changes in the life cycle/state of the Hypervisor alerts are not reflected in Director.
- Alerts that are healthy or dismissed or disabled in the Hypervisor console continues to appear in Director and have to be dismissed explicitly.
- Alerts that are dismissed in Director are not dismissed automatically in the Hypervisor console.