This content has been machine translated dynamically.
Dieser Inhalt ist eine maschinelle Übersetzung, die dynamisch erstellt wurde. (Haftungsausschluss)
Cet article a été traduit automatiquement de manière dynamique. (Clause de non responsabilité)
Este artículo lo ha traducido una máquina de forma dinámica. (Aviso legal)
此内容已经过机器动态翻译。 放弃
このコンテンツは動的に機械翻訳されています。免責事項
이 콘텐츠는 동적으로 기계 번역되었습니다. 책임 부인
Este texto foi traduzido automaticamente. (Aviso legal)
Questo contenuto è stato tradotto dinamicamente con traduzione automatica.(Esclusione di responsabilità))
This article has been machine translated.
Dieser Artikel wurde maschinell übersetzt. (Haftungsausschluss)
Ce article a été traduit automatiquement. (Clause de non responsabilité)
Este artículo ha sido traducido automáticamente. (Aviso legal)
この記事は機械翻訳されています.免責事項
이 기사는 기계 번역되었습니다.책임 부인
Este artigo foi traduzido automaticamente.(Aviso legal)
这篇文章已经过机器翻译.放弃
Questo articolo è stato tradotto automaticamente.(Esclusione di responsabilità))
Translation failed!
Configuring Cribl Stream
What is Cribl Stream
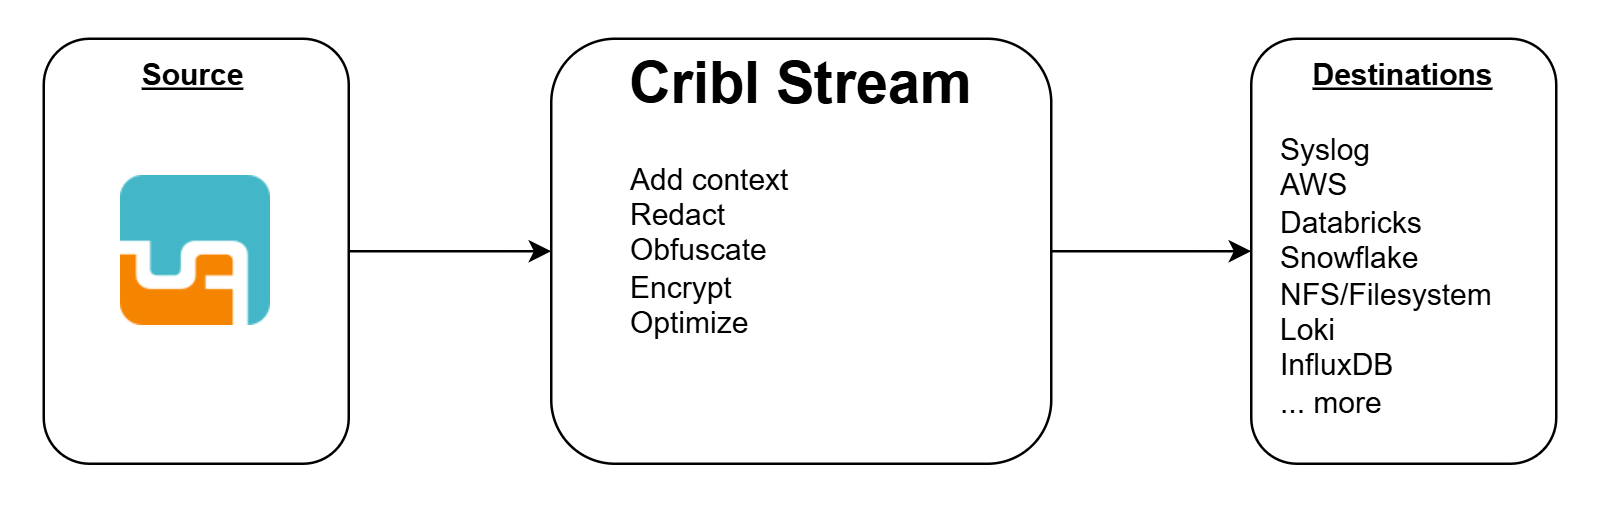
Cribl Stream helps you process machine data – logs, instrumentation data, application data, metrics, etc. – in real time, and deliver them to your analysis platform of choice. It allows you to:
- Add context to your data, by enriching it with information from external data sources.
- Help secure your data, by redacting, obfuscating, or encrypting sensitive fields.
- Optimize your data, per your performance and cost requirements.
Benefits of Using uberAgent® With Cribl Stream
Cribl Stream supports a wide range of data sources and destinations, allowing you to use it as a central hub for data processing. If your analysis platform is not on the list of uberAgent-supported platforms, but is supported by Cribl, you can use Cribl Stream to forward the data to the destination.
Also, Cribl Stream allows you to transform the data before sending it to the destination. This can be useful for enriching, redacting, or optimizing uberAgent’s collected data.
Cribl Stream Configuration
This section describes how to configure Cribl Stream’s Elasticsearch data source, a transforming Cribl pipeline, and the connection between data source, pipeline, and target, to forward data to your analysis platform.
Note: This guide assumes that you have already installed Cribl Stream and added your target platform as destination. If you have not, please refer to the Cribl Stream documentation.
Elasticsearch Data Source
Cribl’s Elasticsearch data source allows you to ingest data from uberAgent into Cribl Stream, as Elasticsearch is supported by uberAgent.
In Cribl Stream, navigate to the Data menu and choose Sources. Search for the Elasticsearch API.
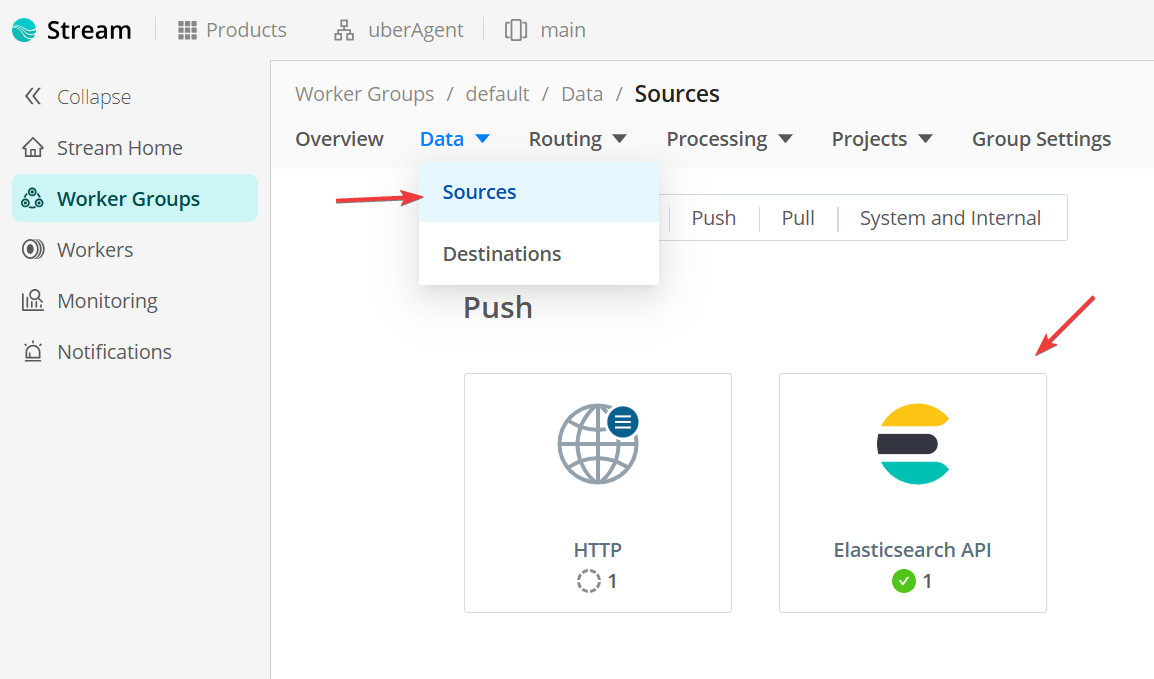
In the next screen, click Add source. Configure the source as follows.
General Settings
- Input ID: Enter a unique name for the source.
- Description: Enter a description for the source.
- Address: Address to bind on. Defaults to 0.0.0.0 (all addresses).
- Port: Port to bind on. E.g. 9200.
-
Elasticsearch API endpoint: Leave the default
/. - Tags: Optionally, add tags to the source.

Authentication
- Authentication type: Basic
- Username: Enter a username.
- Password: Enter a password.

TLS Settings
Cribl allows using the Elasticsearch source over plain and unsecured HTTP. However, we advise using TLS for secure communication. If you have not already configured TLS, please refer to the Cribl Stream documentation.

Remember that the uberAgent endpoints have to trust the Cribl Stream certificate. If you are using a self-signed certificate, please refer to Using uberAgent With Self-Signed Certificates.
Authenticate client (mutual auth) is not supported by uberAgent.
Click Save.
Transforming Pipeline
Cribl Stream allows you to transform data using a pipeline. We documented the required steps to send uberAgent’s data to your target platform. But, you can also use the pipeline to enrich, redact, or optimize the data.
Save the following JSON as input.json.
{
  "id": "uberAgent",
  "conf": {
    "output": "default",
    "streamtags": [],
    "groups": {},
    "asyncFuncTimeout": 1000,
    "functions": [
      {
        "filter": "true",
        "conf": {
          "srcField": "'@timestamp'",
          "dstField": "_time",
          "defaultTimezone": "local",
          "timeExpression": "time.getTime() / 1000",
          "offset": 0,
          "maxLen": 150,
          "defaultTime": "now",
          "latestDateAllowed": "+1week",
          "earliestDateAllowed": "-420weeks"
        },
        "id": "auto_timestamp",
        "description": "Calculates a timestamp field"
      },
      {
        "filter": "true",
        "conf": {
          "remove": [
            "'@timestamp'"
          ]
        },
        "id": "eval",
        "description": "Removes the old timestamp from the _raw event"
      }
    ],
    "description": "Extracts the timestamp"
  }
}
<!--NeedCopy-->
This pipeline does the following:
-
auto_timestamp: Calculates the
_timefield based on uberAgent’s@timestampfield. Otherwise, Cribl would take the time of the data ingestion as the_timefield. But, you want to use the time when the data was collected by uberAgent. -
eval: Removes the old
@timestampfield from the data.
Click on Processing and choose Pipelines.

Click Add Pipeline and choose Import from File. Select the input.json file.
Connection
Now that you have configured the data source and pipeline, you need to connect them to forward the data to your analysis platform.
In the Routing menu, select QuickConnect.
Select the Elasticsearch API source and connect it via drag and drop with the DevNull target. This is a dummy target that discards the data. You can replace it with your target platform.
In the Connection Configuration dialog, select Pipeline. If the dialog does not open automatically, click on the connection.
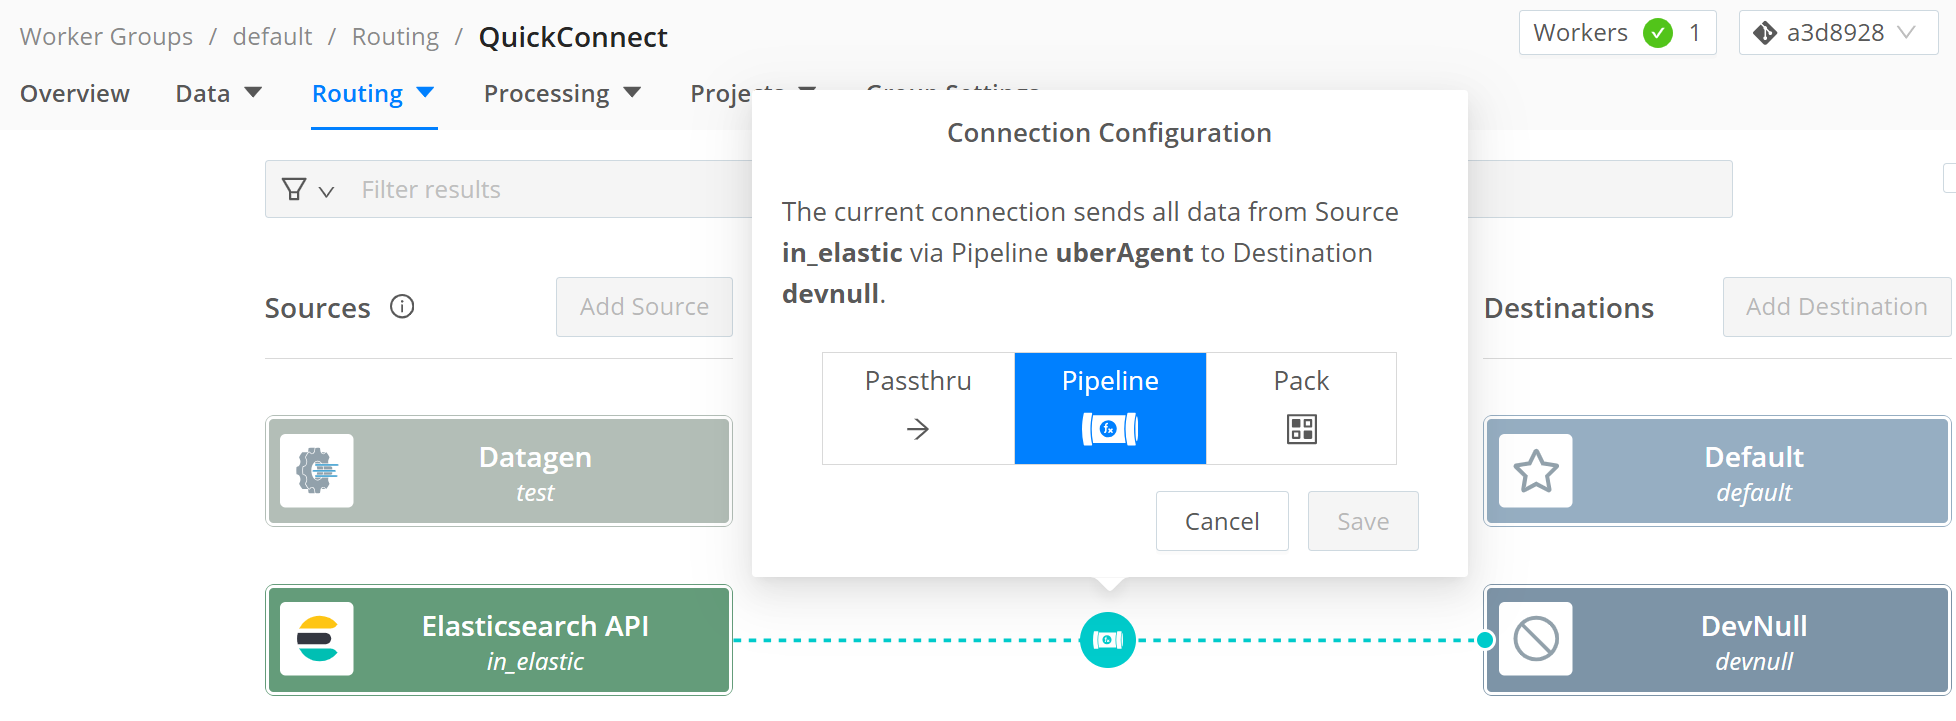
Select the uberAgent pipeline and click Save.
Commit & Deploy
To save the changes, click on the Commit & Deploy button in the top right corner.
uberAgent Configuration
To forward data to Cribl Stream, you need to configure uberAgent to send data to the Cribl Stream Elasticsearch source.
Note: This guide assumes that you have already installed uberAgent. If you have not, please refer to the installation documentation.
Elasticsearch Receiver
Add a new receiver to the uberAgent configuration file. The receiver configuration should look like this:
[Receiver]
Name = Cribl
Type = Elasticsearch
Protocol = HTTP
Servers = https://CRIBL_INGRESS_ADDRESS:9200
RESTToken = username:password
<!--NeedCopy-->
Change the CRIBL_INGRESS_ADDRESS to the address of your Cribl Stream instance. You can find the address in the Cribl Worker Group overview, in the chart Group Information.
Change the RESTToken to the username and password you configured in the Cribl Stream Elasticsearch data source. You can encrypt the RESTToken if desired.
Full Application Names (Optional)
Note: This requires uberAgent 7.4 or later.
By default, uberAgent sends abbreviations for application names to save bandwidth. I.e., it sends Google Chrome as GglChrm. In Splunk dashboards, these abbreviations are expanded to the full application names. This is not available in other backends.
If you want to send the full application names, add the following configuration to the uberAgent configuration file:
[Miscellaneous]
ConfigFlags = AppNameIsAppId
<!--NeedCopy-->
Restart uberAgent
After you have configured the Elasticsearch receiver and, optionally, the full application names, restart the uberAgent service.
Troubleshooting
When the data is not arriving in your target platform, perform the following checks.
Ingress
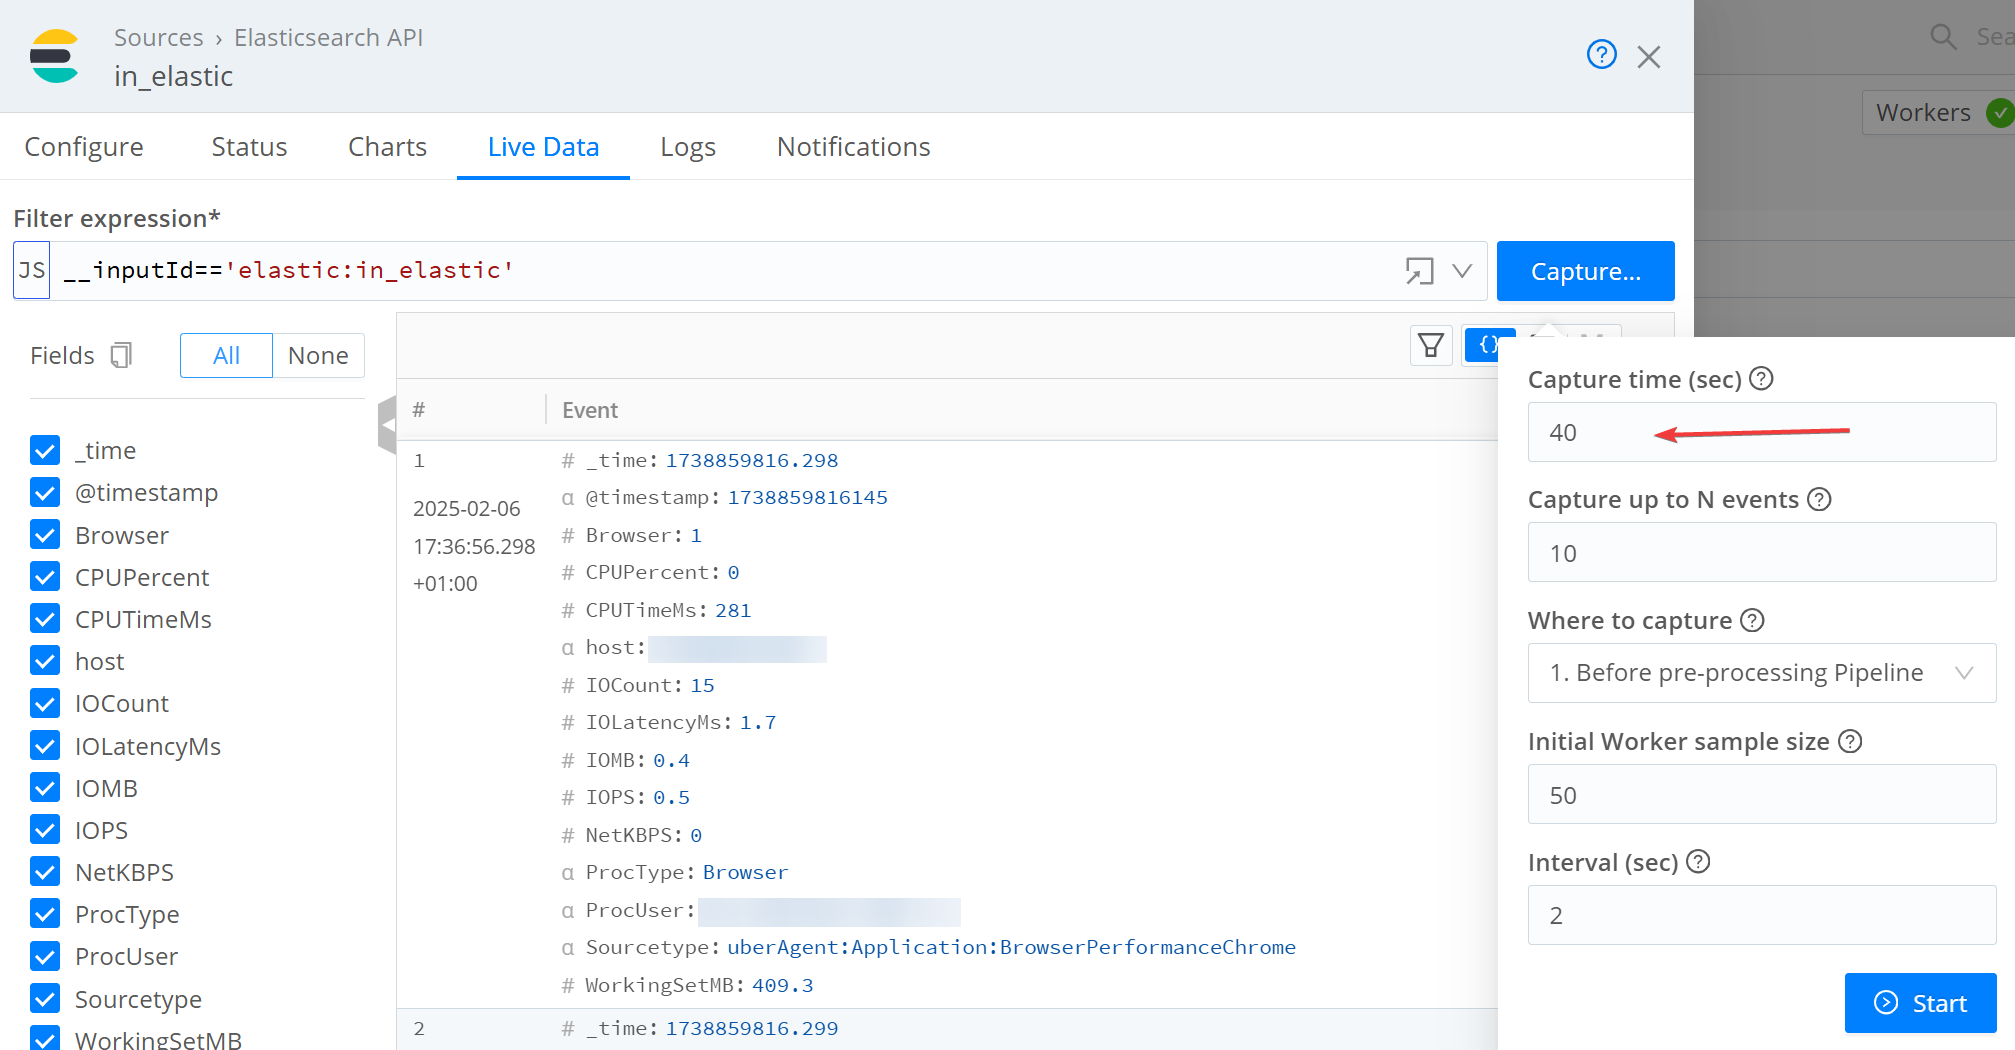
First, check if the data is flowing into Cribl Stream. In the QuickConnect view, click on the Elasticsearch API source and choose Capture. This allows you to see the data flowing into Cribl Stream. Check the Events In and Events Out counters in the Charts menu to monitor the event count and bandwidth.
If you don’t see data immediately, try increasing the capture time to 40 seconds. The default is 10 seconds, but uberAgent collects data every 30 seconds.
Egress
Second, check if the data is flowing through the pipeline to your destination successfully. In the QuickConnect view, click on the DevNull target (or your destination) and choose Capture. This allows you to see the data flowing out of Cribl Stream, after it was modified by the pipeline. If you applied the pipeline correctly, you should not see the @timestamp field in the data (check Ingress above, the @timestamp is visible).
Check the Events In and Events Out counters in the Charts menu to monitor the event count and bandwidth.
Share
Share
This Preview product documentation is Citrix Confidential.
You agree to hold this documentation confidential pursuant to the terms of your Citrix Beta/Tech Preview Agreement.
The development, release and timing of any features or functionality described in the Preview documentation remains at our sole discretion and are subject to change without notice or consultation.
The documentation is for informational purposes only and is not a commitment, promise or legal obligation to deliver any material, code or functionality and should not be relied upon in making Citrix product purchase decisions.
If you do not agree, select I DO NOT AGREE to exit.