Citrix ADC CPX in Kubernetes with Diamanti and Nirmata Validated Reference Design
Features and functions to be tested
Test cases: CPX as Ingress controller and device for North-South and Hairpin East-West:
Setup for all test cases except for VPX as North-South:
- Two CPXs in a cluster (CPX-1, CPX-2)
- ADM as a licensing server
- Prometheus exporter container in a cluster
- Prometheus server and Grafana (either as pods in Kubernetes or external to Kubernetes server)
- Several front-end apps
- Several back-end apps
I. VPX as North-South
-
VPX on an SDX front-end Diamanti platform
- Test SSL Offload and re-encrypt with insertion of X-Forward for every SSL connection
- Insertion of X-Forward on SSL sessions
II. CPX as North-South device
-
CPX-1. Set up HTTPS ingress with support for two or three HTTPS apps with a specified ingress class:
- Demonstrate creation of multiple content switching policies: one per front-end app.
- Demonstrate multiple wildcard certificates per CPX: one wild-card certificate per app.
- Demonstrate CPX offloading and re-encrypting traffic to the front-end apps.
- Demonstrate different load balancing algorithm.
- Demonstrate persistency to one pod.
-
CPX-1. Set up separate TCP ingress with specified ingress class:
- Insert TCP app like MongoDB.
- Show TCP VIP creation.
- Show TCP client traffic hitting MongoDB pod.
- Show default TCP app health checking.
-
CPX-1. Set up separate TCP-SSL ingress with specified ingress class:
- Demonstrate SSL offload and re-encryption for TCP-SSL VIP.
- Repeat test case 2.
-
CPX per app. Use of separate ingress class:
- Repeat test cases 1–3 using CPX-2 supporting one app only.
-
CPX per team. Use of ingress class:
- Assign different ingress classes for 2 teams.
- Demonstrate test case 1 as evidence that CPX can configure ingress rules for individual teams.
-
Autoscale™ the front-end pods:
- Increase traffic to the front-end pods and ensure that the pods autoscale.
- Show that CPX-1 adds new pods to service group.
- Demonstrate for HTTPS ingress VIP.
-
4–7 vCPU Support:
- Configure CPX-1 with 4 or 7 vCPUs.
- Show performance test of HTTPS TPS, encrypted BW throughout.
III. CPX as Hairpin East-West device
-
CPX-1. Create HTTPS ingress for North-South traffic as in described in section I.1:
- Expose the back-end app to the front-end app.
- Show traffic between both apps.
- Expose the back-end app to another back-end app.
- Show traffic between the apps.
-
CPX-1. Follow the directions from step 1. Also, show the end-to-end encryption:
- Back-end app to back-end app encrypted with CPX-1 doing offload and re-encryption.
-
Autoscale back-end pods:
- Demonstrate CPX-1 adding backend autoscaled backend pods to service group.
IV. CPX integration with Prometheus and Grafana
-
Insert Prometheus container into the Kubernetes cluster:
- Configure the container with recommended counters for export for each app.
- Demonstrate exporter container sending counter data to Prometheus server.
- Show Grafana dashboard illustrating data from Prometheus server coming from CPXs.
- The goal is to show that developers can use cloud-native tools that are in popular use for DevOps.
-
Demonstrate integration Kubernetes rolling deployment:
- Insert new version of app in Nirmata.
- Show Kubernetes deploying new app version into the cluster.
- Demonstrate CPX responding to rolling deploy commands from Kubernetes to take 100% of traffic from old version of the app to the new version of the app.
Citrix solution for Citrix ADC CPX deployment
-
Custom protocols: By default, CITRIX INGRESS CONTROLLER automates configuration with the default protocols(HTTP/SSL). CITRIX INGRESS CONTROLLER has support to configure custom protocols (TCP/SSL-TCP/UDP) using annotations.
Annotations:
ingress.citrix.com/insecure-service-type: "tcp"[Annotation to selection LB protocol]ingress.citrix.com/insecure-port: "53"[Annotation to support custom port] -
Fine-tuning CS/LB/Servicegroup parameters: By default, CITRIX INGRESS CONTROLLER configures ADC with default parameters. The parameters can be fine-tuned with the help of NetScaler ADC entity-parameter (lb/servicegroup) annotations.
Annotations:
LB-Method:
ingress.citrix.com/lbvserver: '{"app-1":{"lbmethod":"ROUNDROBIN"}}'Persistence:
ingress.citrix.com/lbvserver: '{"app-1":{"persistencetype":"sourceip"}}' -
Per app SSL encryption: CITRIX INGRESS CONTROLLER can selectively enable SSL encryption for apps with the help of smart annotation.
Annotations:
ingress.citrix.com/secure_backend: '{"web-backend": "True"}[Annotation to selectively enable encryption per application] -
Default cert for ingress: CITRIX INGRESS CONTROLLER can take the default cert as argument. If the ingress definition doesn’t have the secret, then the default certificate is taken. The secret needs to be created once in the namespace, and then all the ingress that are in the namespace can use it.
-
Citrix multiple ingress class support: By default, CITRIX INGRESS CONTROLLER listens for all the ingress objects in k8s cluster. We can control the configuration of ADC (Tier-1 MPX/VPX & Tier-2 CPX) with the help of ingress class annotations. This helps each team to manage the configurations for their ADC independently. Ingress class can help for deploying solutions to configure ADC for a particular namespace as well as a group of name spaces. The support is more generic as compared to provided by other vendors.
Annotations:
kubernetes.io/ingress.class: "citrix"[Notify CITRIX INGRESS CONTROLLER to only configure ingress belonging to a particular class] -
Visibility: Citrix
k8ssolution is integrated withcncfvisibility tools like Prometheous/Grafana for metric collection to support better debugging and analytics. Citrix prometheus exporter can make metrics available to Prometheus for visibility with Grafana as time series charts.
For more information about using the microservices architecture, see the README.md file in GitHub. You can find the .yaml files in the Config folder.
POC story line
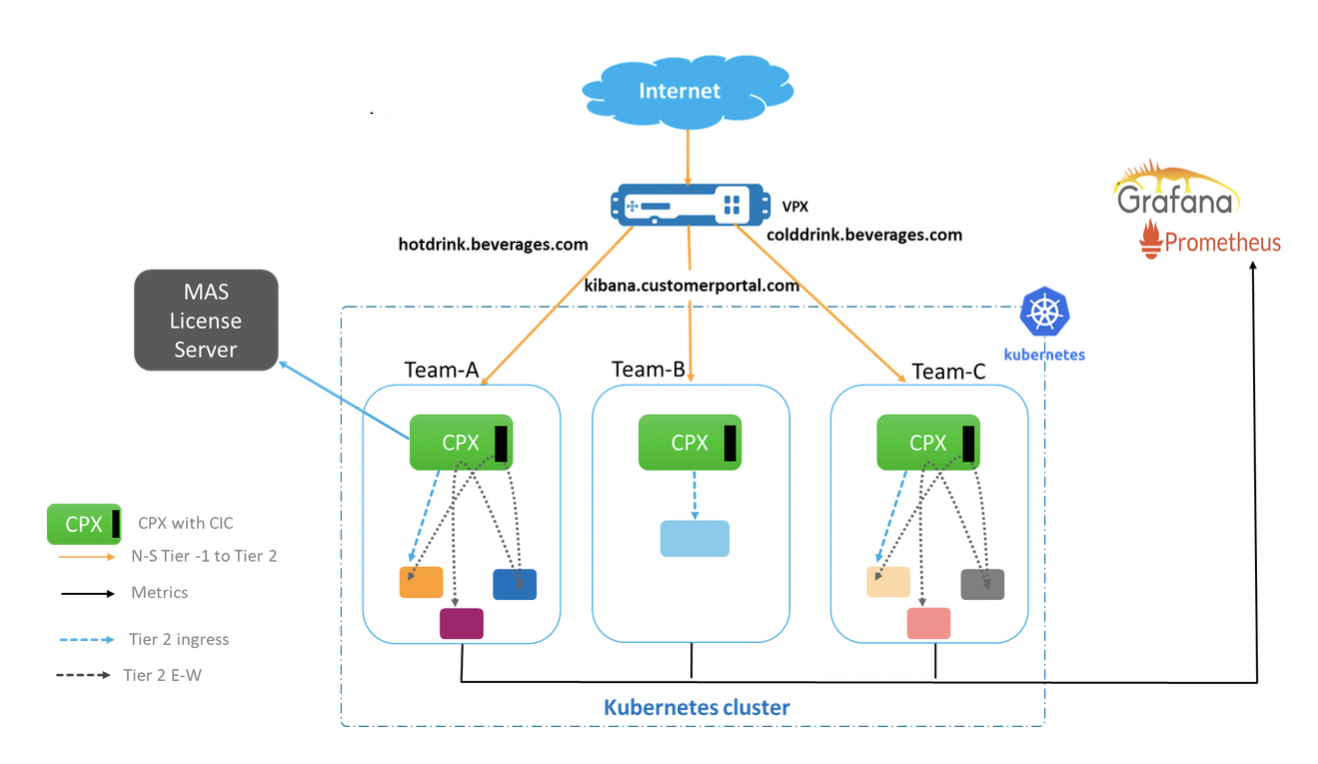
There are three teams running their apps on kubernetes cluster. The configuration of each team is independently managed on different CPXs with the help of citrix ingress class.
The apps for each team are running in separate namespaces(team-hotdrink, team-colddrink, and team-redis) and all the CPXs are running in the CPX namespace.
team-hotdrink: SSL/HTTP Ingress, persistency, lbmethod, encryption/dycription per application, default-cert.
team-colddrink: SSL-TCP Ingress
team-redis: TCP Ingress
POC setup
Application flow
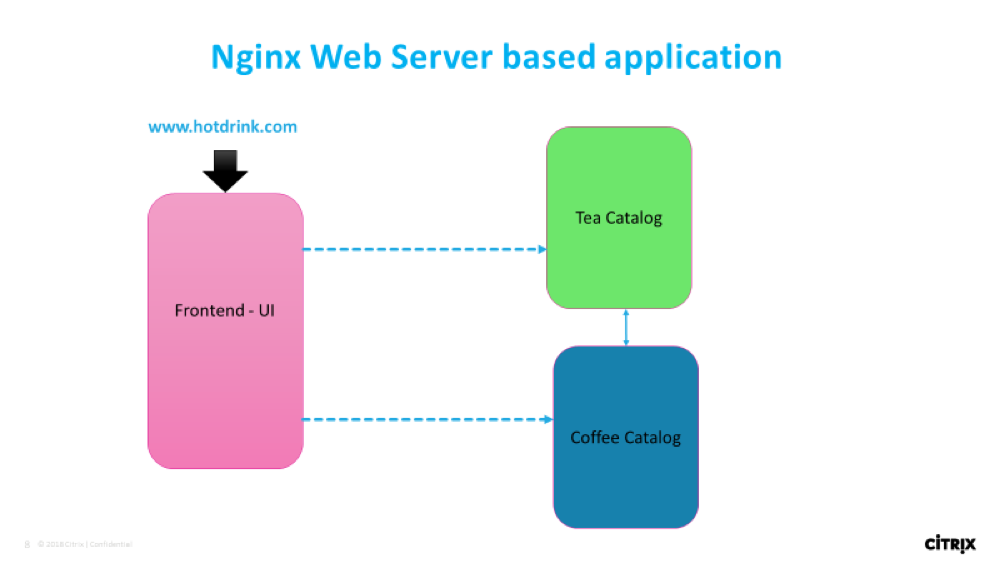
HTTP/SSL/SSL-TCP use-case:
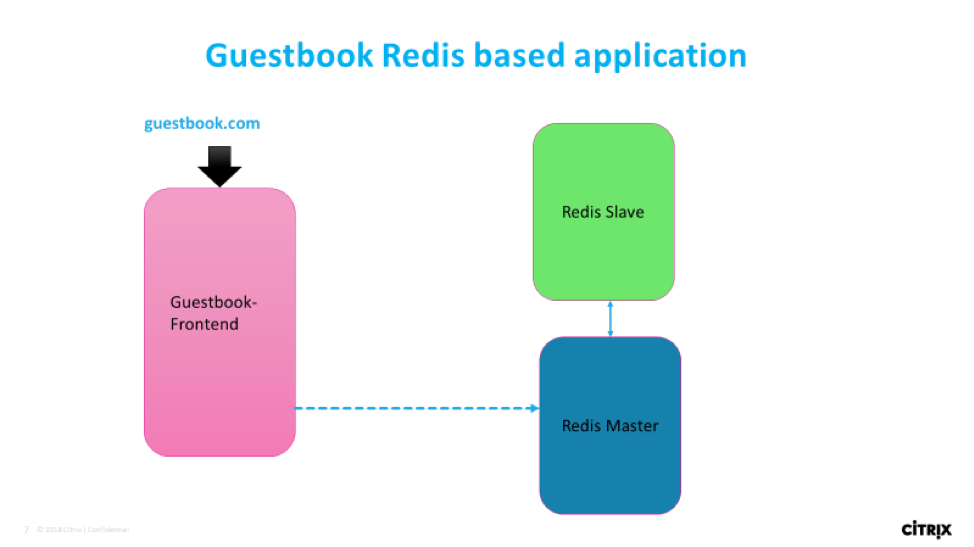
TCP use-case:
Getting the docker images
The provided YAML commands are fetching the images from quay repository.
The images can be pulled and stored in the local repository too. You can use them by editing the Image parameter in YAML.
Step-by-step application and CPX deployment using Nirmata
-
Upload the cluster roles and cluster rolebindings in YAML, and apply them in cluster using Nirmata (rbac.yaml).
- Go to the Clusters tab.
- Select the cluster.
- In settings, apply YAML from the Apply YAMLs option.
-
Create the environment for running CPX and the apps.
- Go to the Environment tab.
- Click Add Environment tab.
- Select the cluster and create environment in the shared namespace.
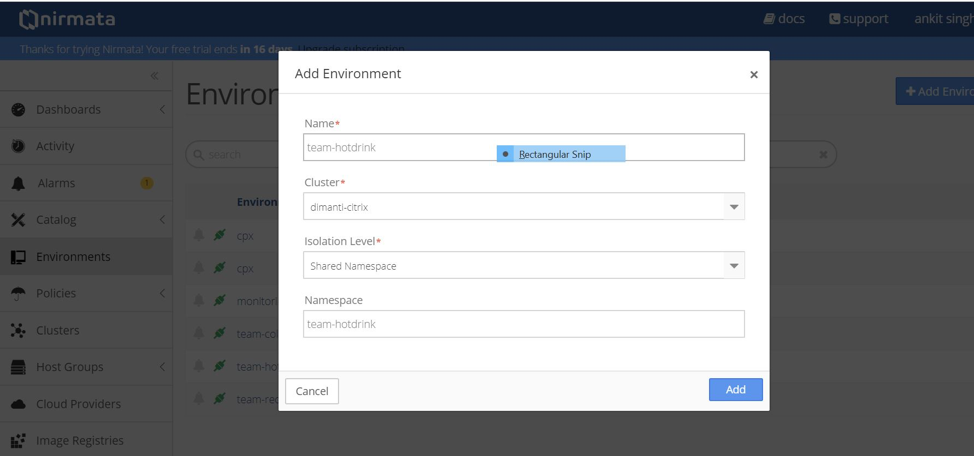
- Create the following environments for running Prometheus, CPX, and apps for different teams.
- Create environment: cpx
- Create environment: team-hotdrink
- Create environment: team-colddrink
- Create environment: team-redis
-
Upload the
.yamlapplication using Nirmata.- Go to the Catalog tab.
- Click Add Application.
-
Click Add to add the applications.
Add application: team-hotdrink (team_hotdrink.yaml). Application name:
team-hotdrink.Add application: team-colddrink (team_coldrink.yaml). Application name:
team-colddrink.Add application: team-redis (team_redis.yaml). Application name:
team-redis.Add application: cpx-svcacct (cpx_svcacct.yaml). Application name: cpx-svcacct.
Note:
CPX with in-built CITRIX INGRESS CONTROLLER requires a service account in the namespace where it is running. For current version in Nirmata, create this using
cpx_svcacct.yamlin the cpx environment.Add application: cpx (cpx_wo_sa.yaml). Application name: cpx.
-
Run the CPX using Nirmata.
- Go to the Environment tab and select the correct environment.
- Click Run Application to run the application.
- In the cpx environment, run the
cpx-svcacctapplication. Selectcpx-svcacctwith the run namecpx-svcacctfrom the Catalog Application. - In the cpx environment, run the cpx application. Select cpx from the Catalog Application.
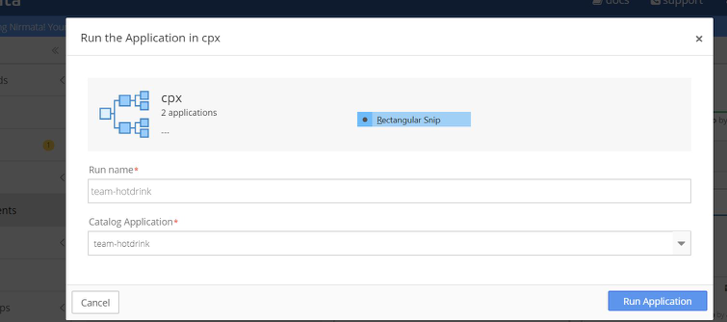
Note:
There are a couple of small workarounds needed for the CPX deployment, because the setup is using an earlier version of Nirmata.
- When creating the CPX deployments, do not set the
serviceAccountName. TheserviceAccountNamecan be added later. As the workaround, automatically redeploy the pods. - Import the TLS secret for the ingress directly in the environment. This ensures that the type field is preserved.
- After running the application, go the CPX application.
- Under the Deployments > StatefulSets & DaemonSets tab, click the
cpx-ingress-colddrinksdeployment. - On the next page, edit the Pod template. Enter CPX in the Service Account.
- Go back to the CPX application.
- Repeat the same procedure for the
cpx-ingress-hotdrinksandcpx-ingress-redisdeployment.
Applying the service account, redeploys the pods. Wait for the pods to come up, and confirm if the service account has applied.
The same can be verified by using the following commands in the Diamanti cluster.
[diamanti@diamanti-250 ~]$ kubectl get deployment -n cpx -o yaml | grep -i account
        serviceAccount: cpx
        serviceAccountName: cpx
        serviceAccount: cpx
<!--NeedCopy-->
Note: If the
serviceAccountis not applied, then cancel the CPX pods. The deployment that recreates it, comes up withserviceAccount.
-
Run the applications using Nirmata.
team-hotdrink application:
- Go to the Environment tab and select the correct environment:
team-hotdrink. - In the
team-hotdrinkenvironment, run theteam-hotddrinkapplication with theteam-hotdrinkrun name. Selectteam-hotdrinkfrom the Catalog Application. - Go to the
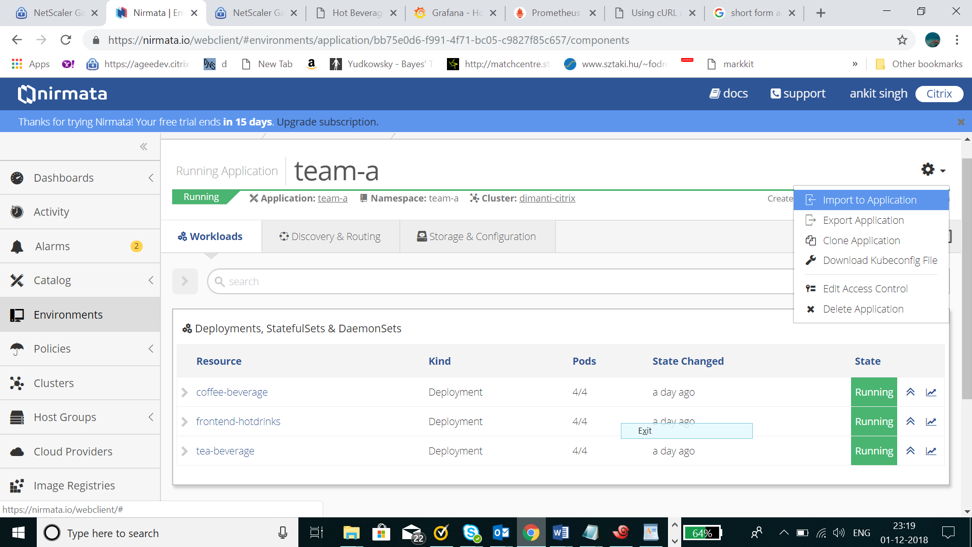
team-hotdrinkapplication. In the upper-right corner of the screen, click Settings and select Import to Application. Uploadhotdrink-secret.yaml.
team-colddrink application:
- Go to the Environment tab and select the correct environment:
team-colddrink. - In the
team-colddrinkenvironment, run theteam-coldddrinkapplication withteam-colddrinkrun name. Selectteam-hotdrinkfrom the Catalog Application. - Go to the
team-colddrinkapplication. In the upper-right corner of the screen, click Settings and select Import to Application. Uploadcolddrink-secret.yaml.
team-redis application:
- Go to the Environment tab and select the correct environment:
team-redis. - In the
team-colddrinkenvironment, run an application with theteam-redisrun name. Selectteam-redisfrom the Catalog Application.- In the
team-redisenvironment, run an application with theteam-redisrun name.
- In the
- Go to the Environment tab and select the correct environment:
Commands on VPX to expose Tier-2 CPX
Tier-1 VPX should do ssl encryption/decription and insert X-forward header while sending to Tier-2 CPX. Tier-1 configuration should be performed manually. X-Forward header can be inserted using -cip ENABLED in servicegroup. Open config.txt.
Create a csverver:
Upload the certkey in Citrix ADC: wild.com-key.pem, wild.com-cert.pem
add cs vserver frontent_grafana HTTP <CS_VSERVER_IP> 80 -cltTimeout 180
<!--NeedCopy-->
Expose www.hotdrinks.com, www.colddrinks.com, www.guestbook.com on Tier-1 VPX:
add serviceGroup team_hotdrink_cpx SSL -cip ENABLED
add serviceGroup team_colddrink_cpx SSL -cip ENABLED
add serviceGroup team_redis_cpx HTTP
add ssl certKey cert -cert "wild-hotdrink.com-cert.pem" -key "wild-hotdrink.com-key.pem"
add lb vserver team_hotdrink_cpx HTTP 0.0.0.0 0
add lb vserver team_colddrink_cpx HTTP 0.0.0.0 0
add lb vserver team_redis_cpx HTTP 0.0.0.0 0
add cs vserver frontent SSL 10.106.73.218 443
add cs action team_hotdrink_cpx -targetLBVserver team_hotdrink_cpx
add cs action team_colddrink_cpx -targetLBVserver team_colddrink_cpx
add cs action team_redis_cpx -targetLBVserver team_redis_cpx
add cs policy team_hotdrink_cpx -rule "HTTP.REQ.HOSTNAME.SERVER.EQ(\"www.hotdrinks.com\") && HTTP.REQ.URL.PATH.STARTSWITH(\"/\")" -action team_hotdrink_cpx
add cs policy team_colddrink_cpx -rule "HTTP.REQ.HOSTNAME.SERVER.EQ(\"www.colddrinks.com\") && HTTP.REQ.URL.PATH.STARTSWITH(\"/\")" -action team_colddrink_cpx
add cs policy team_redis_cpx -rule "HTTP.REQ.HOSTNAME.SERVER.EQ(\"www.guestbook.com\") && HTTP.REQ.URL.PATH.STARTSWITH(\"/\")" -action team_redis_cpx
bind lb vserver team_hotdrink_cpx team_hotdrink_cpx
bind lb vserver team_colddrink_cpx team_colddrink_cpx
bind lb vserver team_redis_cpx team_redis_cpx
bind cs vserver frontent -policyName team_hotdrink_cpx -priority 10
bind cs vserver frontent -policyName team_colddrink_cpx -priority 20
bind cs vserver frontent -policyName team_redis_cpx -priority 30
bind serviceGroup team_hotdrink_cpx 10.1.3.8 443
bind serviceGroup team_colddrink_cpx 10.1.2.52 443
bind serviceGroup team_redis_cpx 10.1.2.53 80
bind ssl vserver frontent -certkeyName cert
<!--NeedCopy-->
Update the IP address to the CPX pod IPs for servicegroup:
root@ubuntu-211:~/demo-nimata/final/final-v1# kubectl get pods -n cpx -o wide
NAME                                      READY     STATUS    RESTARTS   AGE       IP             NODE
cpx-ingress-colddrinks-5bd94bff8b-7prdl   1/1       Running   0          2h        10.1.3.8   ubuntu-221
cpx-ingress-hotdrinks-7c99b59f88-5kclv    1/1       Running   0          2h        10.1.2.52  ubuntu-213
cpx-ingress-redis-7bd6789d7f-szbv7        1/1       Running   0          2h        10.1.2.53  ubuntu-213
<!--NeedCopy-->
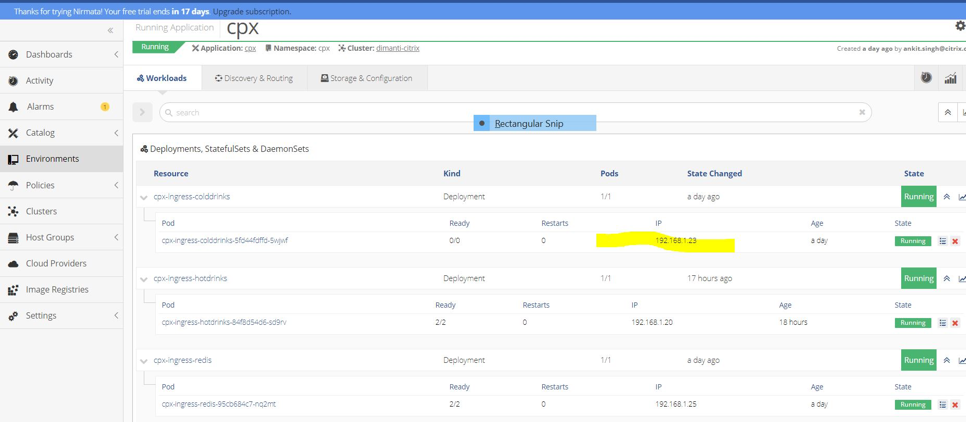
-
To access www.hotdrinks.com, www.colddrinks.com, www.guestbook.com, the hosts file (of the machine from where the pages are to be accessed) should be appended with the following values:
 <CS_VSERVER_IP>      www.hotdrinks.com

 <CS_VSERVER_IP>      www.colddrinks.com

 <CS_VSERVER_IP>      www.guestbook.com
After this is done, the apps can be accessed by visiting: www.hotdrinks.com, www.colddrinks.com, www.guestbook.com
Validating Tier-2 CPX configuration
To validate the CPX configuration, go to the CPX environment. Select the CPX running application.
Select the cpx-ingress-hotdrinks deployment, then click on the cpx-ingress-hotdrinks-xxxx-xxxx pod.
On the next page, go to the running container and launch the terminal for cpx-ingress-hotdrinks by typing the “bash” command.

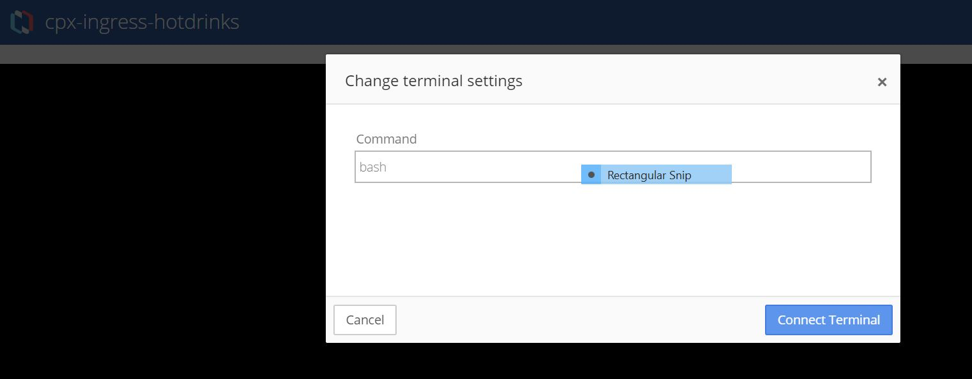
When terminal gets connected, validate the configuration using the regular NetScaler command via cli_script.sh.
- cli_script.sh “sh cs vs”
- cli_script.sh “sh lb vs”
- cli_script.sh “sh servicegroup”
The validation can be done for other CPX deployment for team-colddrink and team-mongodb in the same manner.
Performing scale up/scale down
To perform scale up/scale down:
- Go to the
team-hotdrinkenvironment. Select theteam-hotdrinkrunning application. - Click the
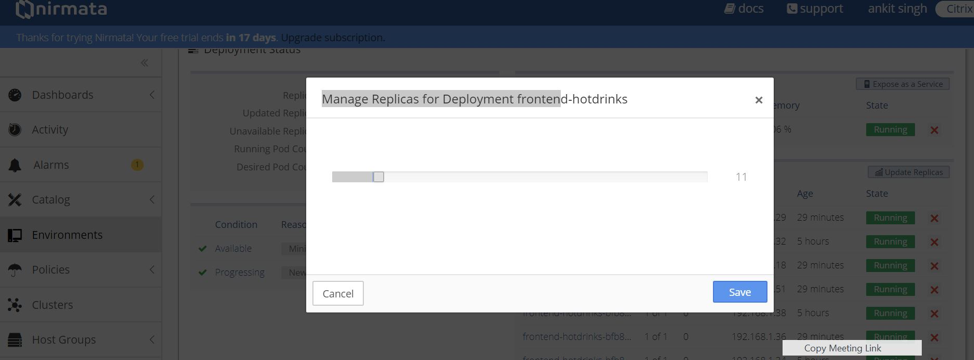
frontend-hotdrinksdeployment. - On the next page, click Update replicas. Increase it to 10.
Refer: Validating Tier-2 CPX configuration to check the configuration in CPX (deployment: cpx-ingress-hotdrinks).
- Go to the CPX environment. Select a running CPX application.
- Click the
cpx-ingress-hotdrinksdeployment. - Click the
cpx-ingress-hotdrinks-xxxx-xxxxpod. - On the next page, go to the running container and launch the terminal for
cpx-ingress-hotdrinksby typing the “bash” command. -
cli_script.sh "sh servicegroup < servicegroup name >".
Performing rolling update
To perform rolling update:
- Go to the
team-hotdrinkenvironment. Select theteam-hotdrinkrunning application. - Deploy the frontend-hotdrinks.
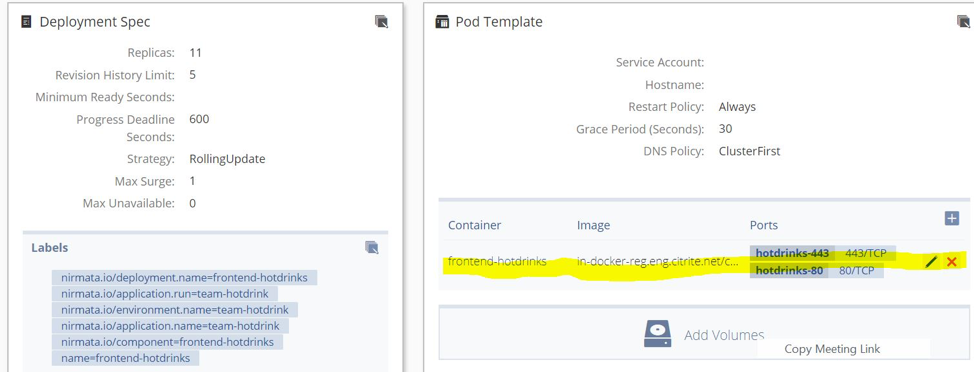
- On the next page, go to the Pod template.
- Update the image to: quay.io/citrix/hotdrinks-v2: latest.
- Let the update complete.
- Access the application again. The new page should come with an updated image after rolling the update.
Deploying Prometheus
NetScaler® Metrics Exporter, Prometheus, and Grafana are being used to automatically detect and collect metrics from the ingress CPX.
Steps to deploy Prometheus:
Create the environments for running CPX and the apps:
- Go to the Environment tab.
- Click Add Environment.
- Create the environments for running Exporter, Prometheus, and Grafana.
- Create the environment: monitoring.
Upload the .yaml file using Nirmata:
- Go to the Catalog tab.
- Click Add Application.
- Click Add to add the applications.
- Add application: monitoring (monitoring.yaml).
Running Prometheus application:
- Go to the Environment tab and select the correct environment: monitoring.
- Click Run Application using the name monitoring.
- This deploys the Exporter, Prometheus, and Grafana pods, and begins to collect metrics.
- Now Prometheus and Grafana need to be exposed through the VPX.
Commands on the VPX to expose Prometheus and Grafana:
Create a csvserver:
add cs vserver frontent_grafana HTTP <CS_VSERVER_IP> 80 -cltTimeout 180
<!--NeedCopy-->
Expose Prometheus:
add serviceGroup prometheus HTTP
add lb vserver prometheus HTTP 0.0.0.0 0
add cs action prometheus -targetLBVserver prometheus
add cs policy prometheus -rule "HTTP.REQ.HOSTNAME.SERVER.EQ(\"www.prometheus.com\") && HTTP.REQ.URL.PATH.STARTSWITH(\"/\")" -action prometheus
bind lb vserver prometheus prometheus
bind cs vserver frontent_grafana -policyName prometheus -priority 20
bind serviceGroup prometheus <PROMETHEUS_POD_IP> 9090
<!--NeedCopy-->
Note:
Get the prometheus-k8s-0 pod IP using “kubectl get pods -n monitoring -o wide”
Expose Grafana:
add serviceGroup grafana HTTP
add lb vserver grafana HTTP 0.0.0.0 0
add cs action grafana -targetLBVserver grafana
add cs policy grafana -rule "HTTP.REQ.HOSTNAME.SERVER.EQ(\"www.grafana.com\") && HTTP.REQ.URL.PATH.STARTSWITH(\"/\")" -action grafana
bind lb vserver grafana grafana
bind cs vserver frontent_grafana -policyName grafana -priority 10
bind serviceGroup grafana <GRAFANA_POD_IP>  3000
<!--NeedCopy-->
Note:
Get the grafana-xxxx-xxx pod IP using
kubectl get pods -n monitoring -o wide
-
Now the Prometheus and Grafana pages have been exposed for access via the cs vserver of the VPX.
-
To access Prometheus and Grafana, the hosts file (of the machine from where the pages are to be accessed) should be appended with the following values:
<CS_VSERVER_IP> www.grafana.com <CS_VSERVER_IP> www.prometheus.com -
When this is done, access Prometheus by visiting www.prometheus.com. Access Grafana by visiting www.grafana.com.
Visualize the metrics:
- To ensure that Prometheus has detected the Exporter, visit www.prometheus.com/targets. It should contain a list of all Exporters which are monitoring the CPX and VPX devices. Ensure all Exporters are in the UP state. See the following example:

-
Now you can use Grafana to plot the values which are being collected. To do that:
- Go to www.grafana.com. Ensure that an appropriate entry is added in the host file.
- Login using the default username admin and password admin.
- After logging in, click Add data source in the home dashboard.
- Select the Prometheus option.
- Provide/change the following details:
- Name: prometheus (all lowercase).
- URL:
http://prometheus:9090. - Leave the remaining entries with default values.
- Click Save and Test. Wait for a few seconds until the Data source is working message appears at the bottom of the screen.
- Import a pre-designed Grafana template by clicking the
+icon on the left hand panel. Choose Import. - Click the Upload json button and select the sample_grafana_dashboard.json file (Leave Name, Folder, and Unique Identifier unchanged).
- Choose Prometheus from the prometheus dropdown menu, and click Import.
-
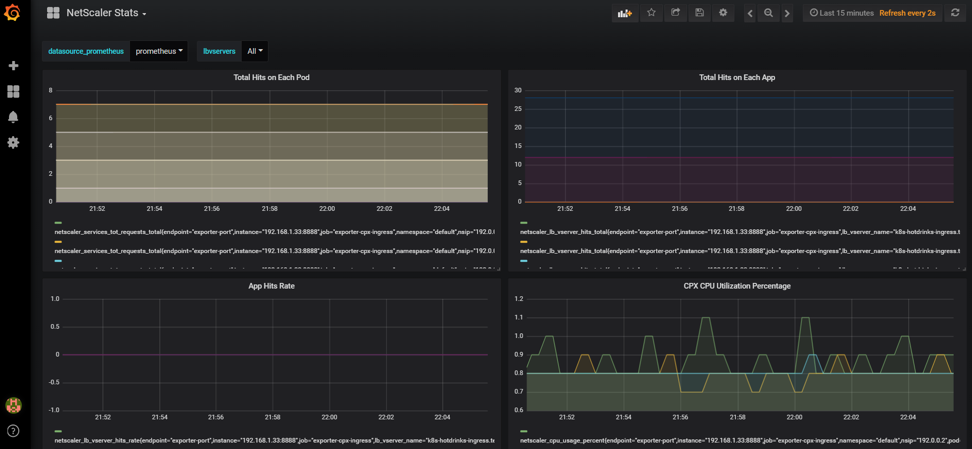
This uploads a dashboard similar to the following image:
Licensing and performance tests
Running CPXs for perf and licensing.
The number of CPX cores and license server details is given in the following environment variables.
Environment variable to select the number of cores
- name: “CPX_CORES”
- value: “3”
Environment variable to select the license server
- name: “LS_IP”
-
value: “X.X.X.X”
Diamanti annotations:
diamanti.com/endpoint0: '{"network":"lab-network","perfTier":"high"}Point to correct license server by setting correct IP above.
- Add the mentioned above environment variables as well as Diamanti specific annotations in the
cpx-perf.yamlfile. - Go to the Environment tab and create the
cpx-perfenvironment.
Upload the YAML application using Nirmata.
- Go to the Catalog tab.
- Click Add Application.
- Click Add to add an application:
cpx-perf.yaml. Application name:cpx-perf.
Running CPX:
- Go to the Environment tab and select the
cpx-perfenvironment. - In the
cpx-perfenvironment, run thecpx-svcacctapplication. - In the
cpx-perfenvironment, run thecpx-perfapplication. - After running the application, go to the
cpx-perfapplication. - Under Deployments > StatefulSets & DaemonSets tab, click on the
cpx-ingress-perfdeployment. On the next page, edit the Pod template. Enter CPX in the Service Account. - Validate the license is working and that the license checkout is happening in Citrix ADM.
- To validate on the CPX, perform the following steps:
- kubectl get pods -n cpx
- kubectl exec -it
-n cpx bash - cli_script.sh ‘sh licenseserver’
- cli_script.sh ‘sh capacity’
- View a similar output:
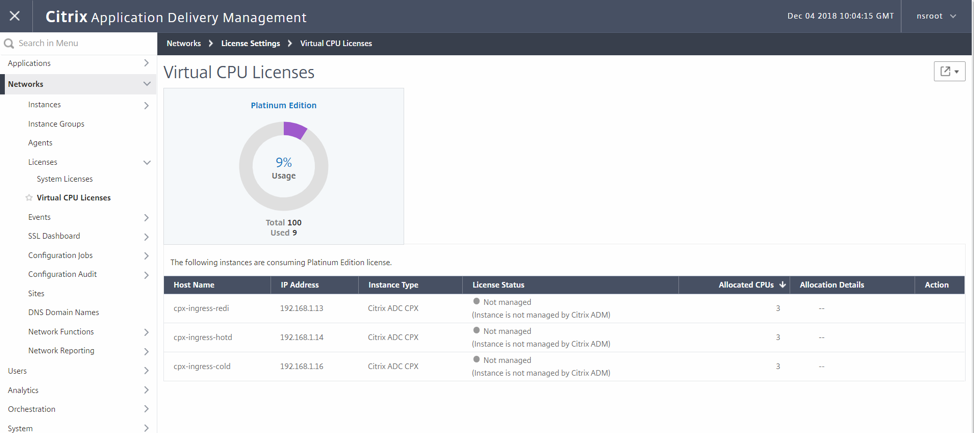
root@cpx-ingress-colddrinks-66f4d75f76-kzf8w:/# cli_script.sh 'sh licenseserver' exec: sh licenseserver 1) ServerName: 10.217.212.228Port: 27000 Status: 1 Grace: 0 Gptimeleft: 0 Done root@cpx-ingress-colddrinks-66f4d75f76-kzf8w:/# cli_script.sh 'sh capacity' exec: sh capacity Actualbandwidth: 10000 VcpuCount: 3 Edition: Platinum Unit: Mbps Maxbandwidth: 10000 Minbandwidth: 20 Instancecount: 0 Done <!--NeedCopy-->- To validate on the ADM, go to the license server and navigate to the Networks > Licenses > Virtual CPU Licenses.
- Here you should see the licensed CPX along with the core count.
- To validate on the CPX, perform the following steps:
- Add the mentioned above environment variables as well as Diamanti specific annotations in the
Annotations table
| Annotation | Possible value | Description | Default (if any) |
|---|---|---|---|
| kubernetes.io/ingress.class | ingress class name | It’s a way to associate a particular ingress resource with an ingress controller. For example, kubernetes.io/ingress.class:"Citrix"
|
Configures all ingresses |
| ingress.citrix.com/secure_backend | Using the .json format, list the services for secure-backend | Use True, if you want Citrix ADC to connect your application with the secure HTTPS connection. Use False, if you want Citrix ADC to connect your application with an insecure HTTP connection. For example, ingress.citrix.com/secure_backend: {‘app1’:"True", ‘app2’:"False", ‘app3’:"True"}
|
“False” |
| ingress.citrix.com/lbvserver | In JSON form, settings for lbvserver | It provides smart annotation capability. Using this, an advanced user (who has knowledge of NetScaler LB Vserver and Service group options) can directly apply them. Values must be in the .json format. For each back-end app in the ingress, provide a key value pair. Key name should match with the corresponding CLI name. For example, ingress.citrix.com/lbvserver: '{"app-1":{"lbmethod":"ROUNDROBIN"}}'
|
Default values |