How AOT Works
The Big Picture
Always On Tracing is supported across both Citrix Virtual Apps and Desktops™ (CVAD) on-premises deployments and Citrix DaaS™ cloud-hosted deployments, providing consistent diagnostic capabilities regardless of where your infrastructure runs.
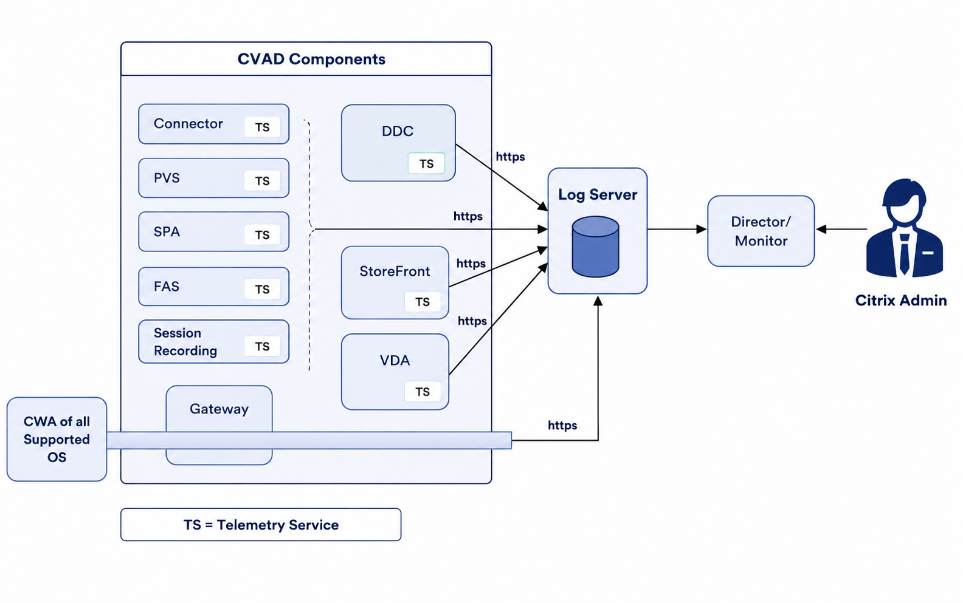
Every Citrix component equipped with the Telemetry Service becomes an AOT log collector. Once you configure the Log Server address in Web Studio (or DaaS Settings), the Telemetry Service on each component activates, begins collecting logs, and forwards them to the Log Server automatically.
Step-by-Step Data Flow
1. Administrator Configures AOT
The administrator enters the Log Server address, port, and authentication key in Citrix Web Studio (on-prem) or DaaS Settings (cloud).
- The configuration is written to the Site database.
- Delivery Controllers read the updated settings and distribute them to VDAs in the selected delivery groups.
- StoreFront™, Director, and other supported components receive the same settings via the same mechanism.
2. Telemetry Service Activates
Once each component receives the Log Server configuration, its local Telemetry Service activates the real-time AOT listener. This listener tracks predefined events, step traces, and error conditions — capturing log data as events occur with no trigger required.
3. Logs Transfer to Log Server
The Telemetry Service transfers logs directly to the Log Server over HTTPS. In environments where clients connect through Citrix Gateway, log transfer occurs over a SOCKS tunnel.
4. Log Server Stores and Indexes
The Log Server receives each log entry, parses it, and indexes it into OpenSearch. Logs are compressed using LZ4 (~2:1 ratio), retained for the configured period (default: 7 days), and automatically purged when disk usage exceeds 85%.
Key Components
AOT Log Generators
Supported generators: DDC, VDA (Windows/Linux/Mac), StoreFront, Director, FAS, PVS, Session Recording, WEM, UPM, NetScaler®, License Server, Cloud Connector, Citrix Workspace App. The Telemetry Service ships with all supported CVAD components running on Windows OS, and an independent service (where Telemetry Service isn’t supported) to forward the logs to Log Server — no additional installation is needed.
Centralized Log Server
The Log Server is a Docker-containerized service that includes an ingestion endpoint, an OpenSearch backend, CLI scripts for log download, and a REST API for Director/Monitor queries. It runs on Linux VM, Windows VM, or Citrix Connector Appliance.
Log Retention and Purge
| Setting | Default | Range |
|---|---|---|
MAX_RESERVE_DAYS |
7 days | 1–30 days |
MAX_DISK_USAGE_PERCENTAGE |
85% | 10–90% |
Log Structure
| Field | Description |
|---|---|
MachineName |
Hostname where the log originated |
MachineIP |
IP address of the source machine |
Role |
Citrix component role (VDA, DDC, StoreFront, etc.) |
TimeStamp |
UTC timestamp of the log event |
Message |
Log content — searchable by keyword |
Level |
Severity: Info, Warning, Error |
Module |
Software module that generated the log |
ProcessName |
Process that generated the log |
ProcessId |
Process ID |
Thread |
Thread ID |
Cpu |
CPU ID at the time of the log |
SessionId |
User session ID associated with the log |
Class |
Class or component within the module |
Log Server Capacity Limits
| Metric | Limit |
|---|---|
| Active component connections | 128,000 |
| Log ingestion rate | 10,000 events/second |
| Burst tolerance | ~2× normal rate without loss |
| Log Servers per environment | 1 (current limitation) |
Note:
The bottleneck is log throughput (events per second), not the number of connected machines. A large environment with 100,000 machines generating modest log volume can run on a single Log Server, as long as the 10,000 EPS threshold is not exceeded during peak activity. Warning:
Currently, only one Log Server per environment is supported. Support for multiple Log Servers and horizontal scaling is planned for a future release.