View graphical event statistics
Event data visualization is available for each recording. It provides graphical event statistics for you to quickly comprehend the events inserted in recordings.
To view graphical event statistics, complete the following steps:
-
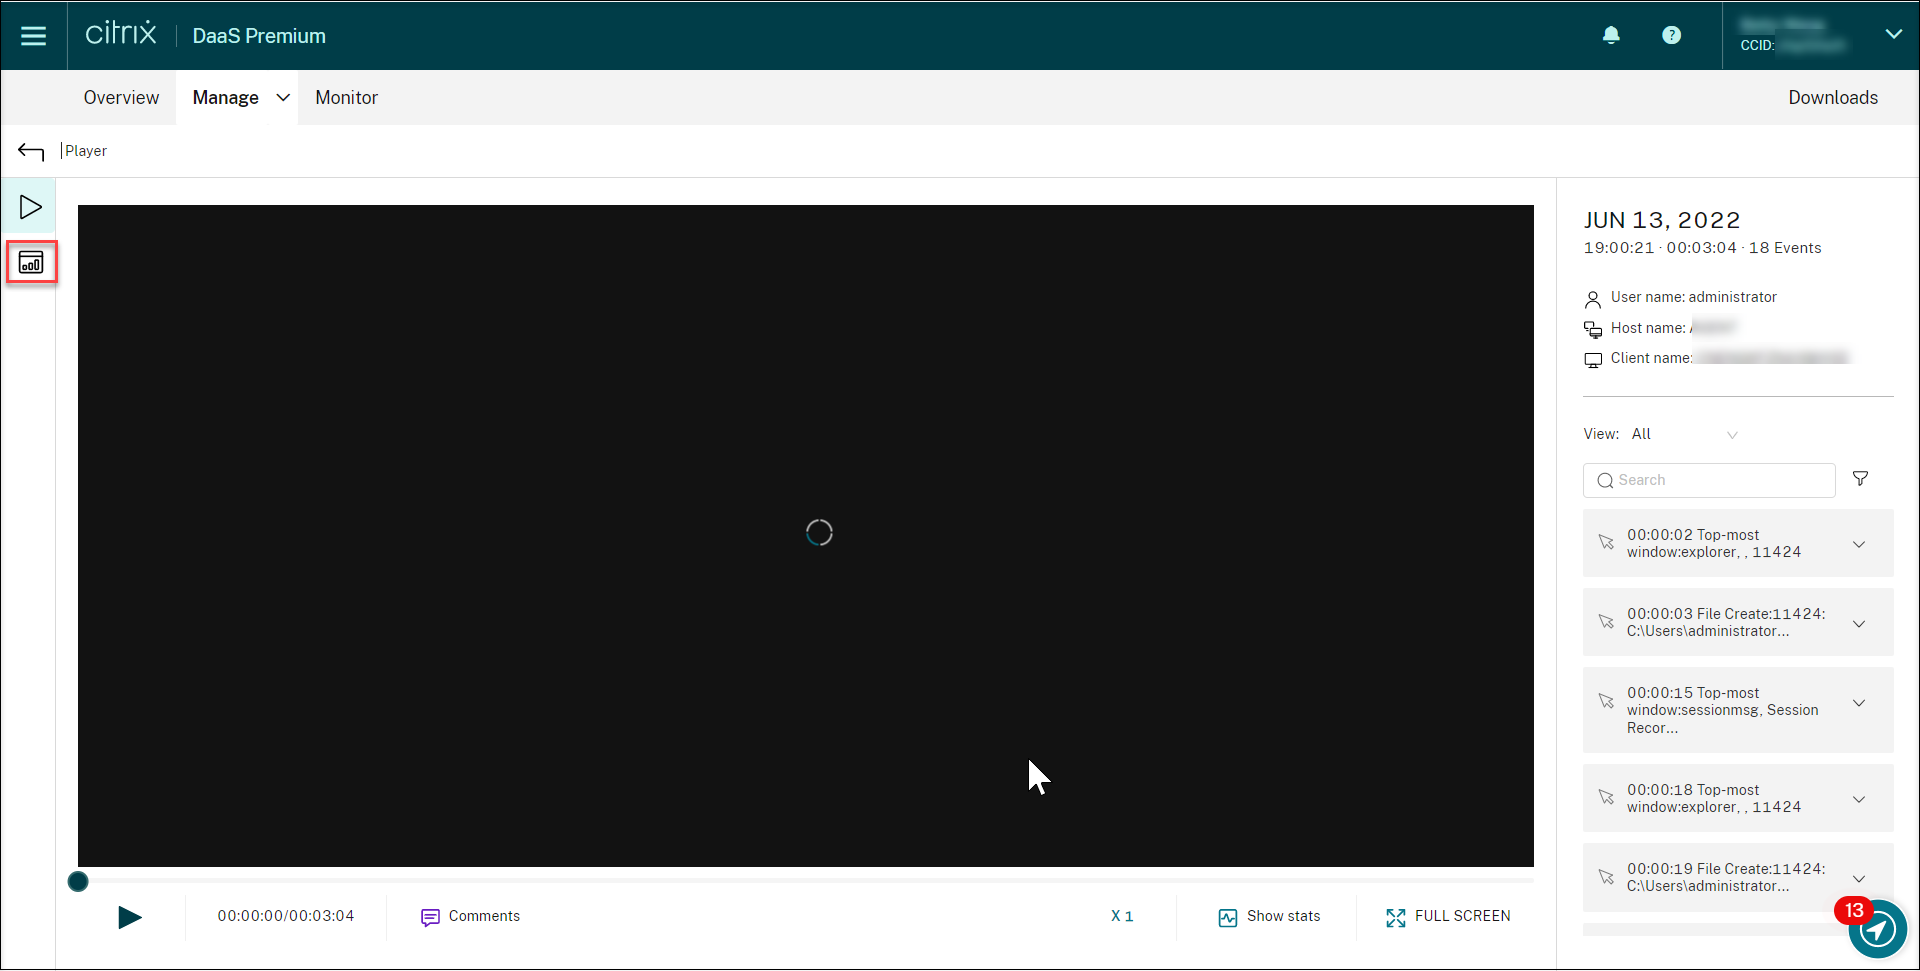
Open and play a recording.
-
In the upper left corner of the playback page, click the statistics icon.
-
Switch between the Screen time, File transfers, Commands, Printing, and Events tabs to view statistics from different perspectives.
-
Screen time
The Screen time tab lets you know the cumulative time an application window is in focus (active window).

There is a horizontal time bar next to each application. Click the bar to view the start time and duration each time an application becomes and stays in focus, respectively. You can narrow down your search range by specifying a duration range other than the default All option. For example:

-
File transfers
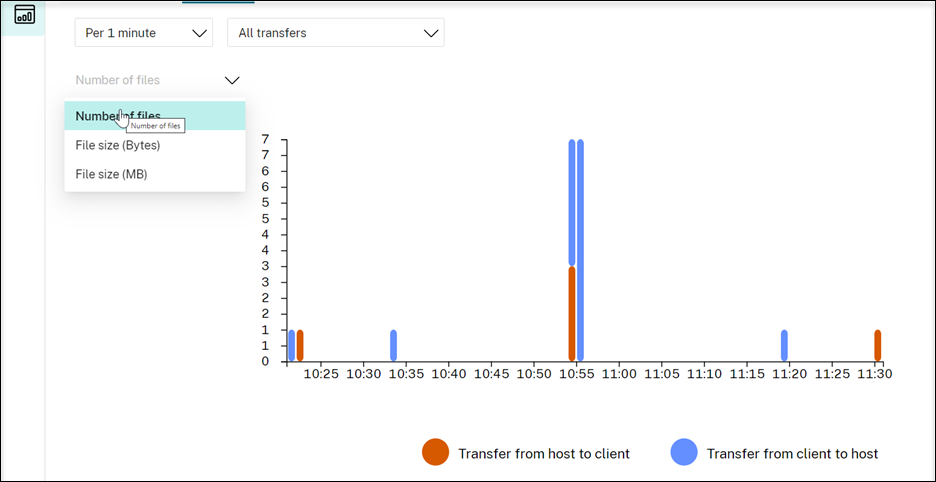
The File transfers tab provides graphical statistics about bidirectional file transfers between the VDA hosting the recorded session and the client device where the session runs. You can customize the visualization by using the following settings:
- Time granularity: Per 1 minute, Per 10 minutes, Per hour
- File transfer destination: All transfers, Transfer from host to client, Transfer from client to host
- Number or size (Bytes or MB) of transferred files
The X axis represents the absolute time in the 24-hour system.
-
Commands
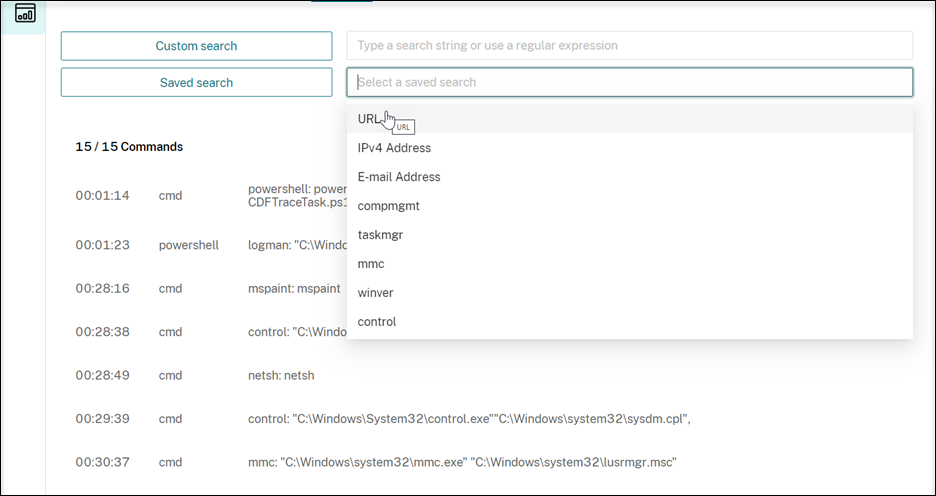
The Commands tab shows CMD and PowerShell commands that are run during the recorded session. You can customize the data display by typing your custom search in Custom search or selecting a saved search from Saved search. The “OR” logical operator is used to compute the final action.
-
Printing
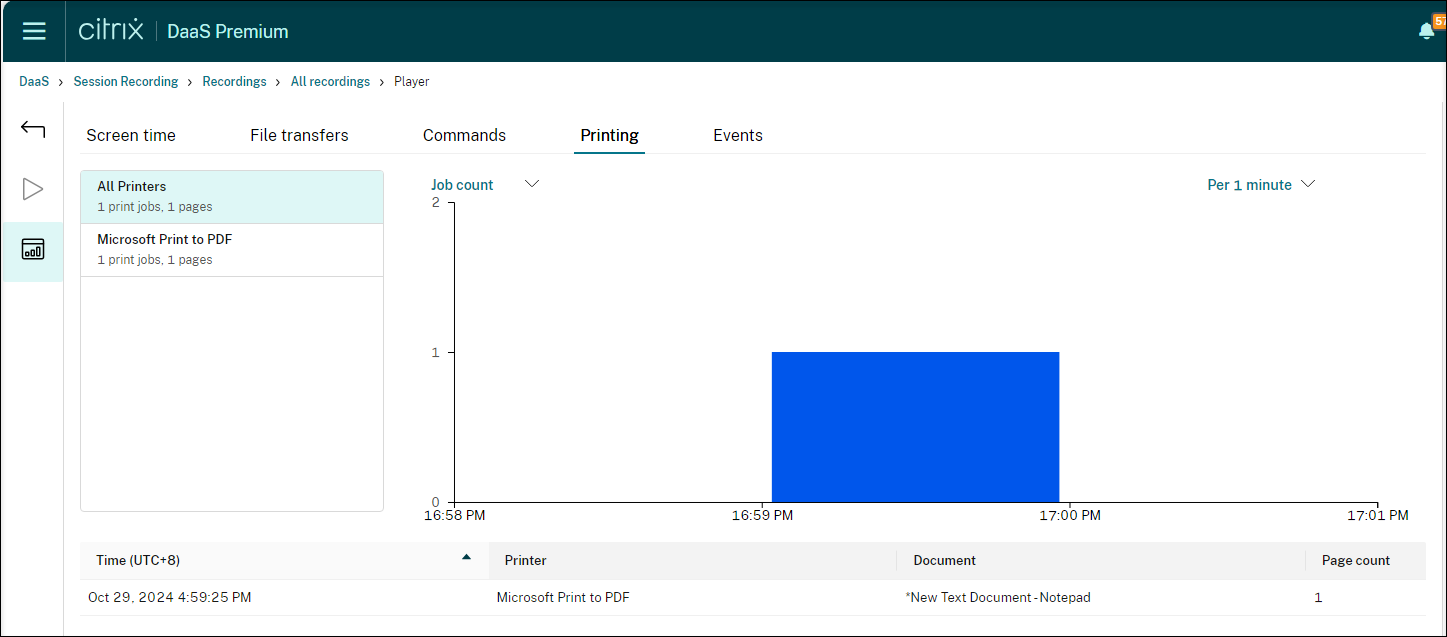
The Printing tab provides graphical statistics of printing activities in the recorded session.
-
Events
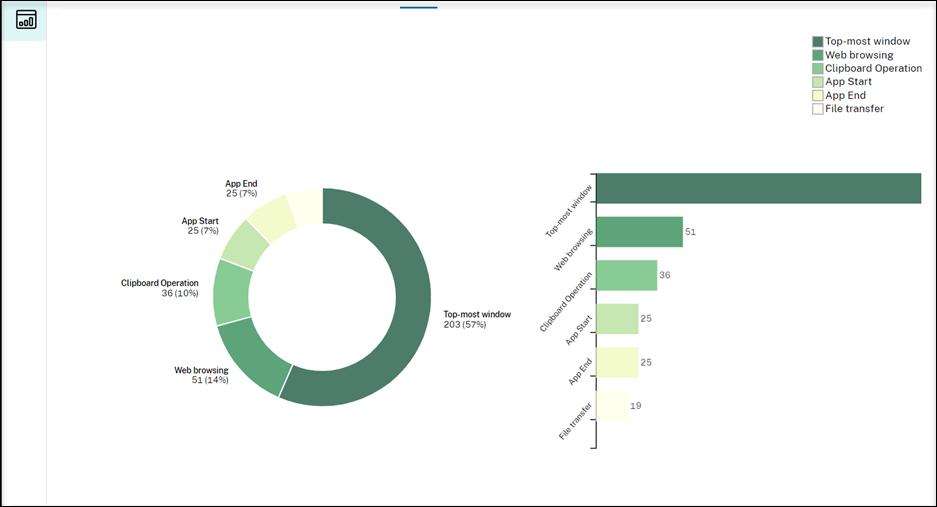
The Events tab shows the proportions and numbers of all types of events in the recorded session.
-